Understanding the IO Monitor Display
The IO Monitor display is split into an overview section at the top and an detail section at the bottom.
- In the overview section, IO Monitor displays the basic information for each I/O message.
- In the detail section, IO Monitor displays detailed information about an I/O message you have chosen. Refer to Monitoring I/O Messages on the Display for a description of I/O messages.
See below for a screen shot of the Windows product, the Linux product, more information on menus, buttons, the Overview section of the display, the Detail section of the display, and the status bar.
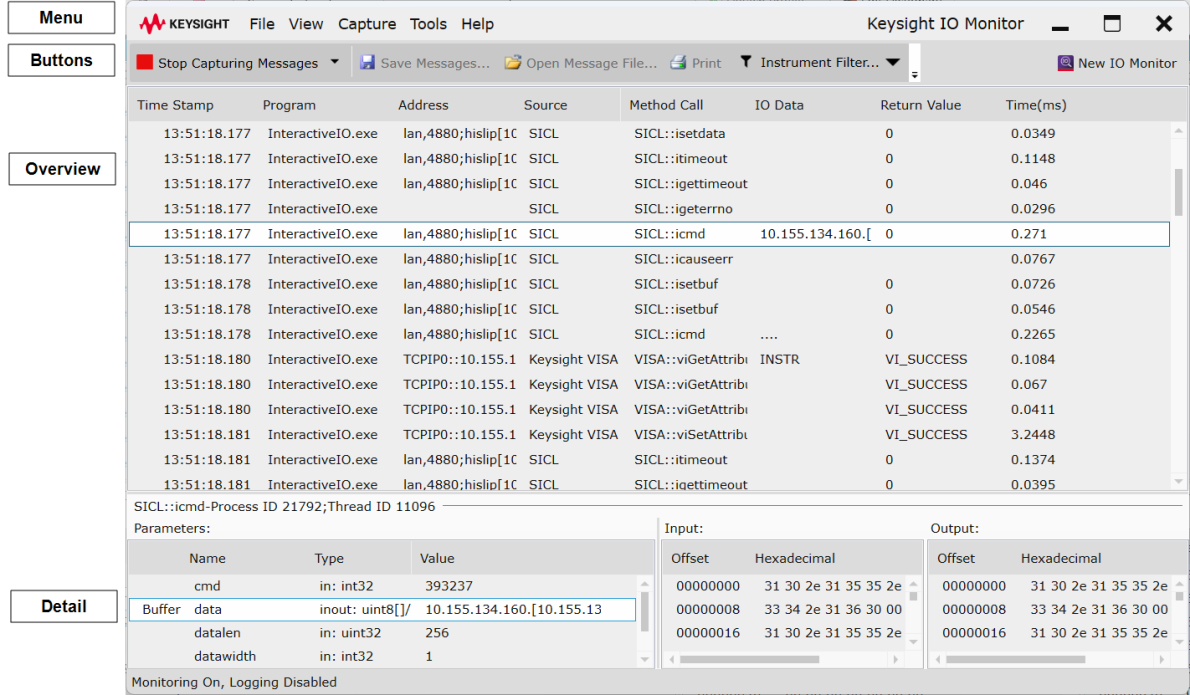
IO Monitor Display (Windows)
Menus
File menu
- Save Message As - Saves currently displayed messages as a log file. You can choose either CSV or XML as the file format.
- Open Message File For Viewing - Opens a dialog where you can browse for and then view an existing .xml message file. (Same as the Open Message File button).
- Print Displayed Messages - This feature is currently Windows only.
- Exit - Closes IO Monitor.
View menu
- Clear Messages - Clears messages from the display.
- Optimize Display - (Two options)
-
- Optimize for Viewing: The screen updates after every I/O operation. This has the potential of slowing down the overall system I/O activity.
- Optimize for Speed: The screen updates approximately every 1/2 second - regardless of the number of I/O operations. Thus it does not noticeably slow down I/O activity.
Capture menu
- Start Capture / Don't Log Captured Messages - Begin the capture of messages to the display without logging them to an .xml file.
- Start Capture / Log To New Message File - Start capturing messages to the display, and open a dialog that lets you create / name a new .xml file for logging those messages. This dialog also lets you choose a maximum size (in MB) for that log file. Once you have created an .xml file for active logging, a status bar for the log file will appear just below the buttons and above the Overview section, displaying the name of the open log file and the percent full with respect to the maximum size you set.
- Start Capture / Log to Open Message File - Start capturing messages to the display, and log to the file that is currently open. This menu option is only available if you previously started and then stopped capturing without closing the log. (
 In Linux, you also have the option to select the "overwrite existing log file" checkbox, in the event that the chosen filename is identical to an existing log file.)
Tools menu
- Settings .... Open the Changing IO Monitor Settings dialog.
Help menu
Open the IO Monitor help file (this file), help for the various programming libraries, or the About box (to verify your installed version).
Toolbar buttons
Toolbar buttons are shortcuts for many of the above menu commands. Available buttons vary by OS. If you do not see all the buttons in the row, you may need to increase your window / display size by hovering over the left or right edge of the program window and dragging.
- Start Capturing Messages (shortcut for Capture menu items)
- Save Messages (shortcut for File > Save Message As)
- Open Message File (shortcut for File > Open Message File For Viewing)
- Print (shortcut for File > Print Displayed Messages)
- Instrument Filter - Opens a dialog that lets you use check boxes to customize which connected instruments to display or log messages for.
- Clear Messages (shortcut for View > Clear Messages)
- Settings... - Opens the IO Monitor Settings dialog.
- New IO Monitor - Launches the new IO Monitor. This launch link appears only if you selected the new Interactive IO during installation. Note: To avoid conflicts, do not run New IO Monitor and Classic IO Monitor simultaneously.
Overview Section
IO Monitor displays messages originating from VISA APIs. It allows you to automatically group relevant asynchronous VISA APIs, accumulate the time spent on them, and present the aggregated data and elapsed time as a single API entry. This feature mimics the behavior of synchronous viRead/viWrite APIs, providing a clearer overview of asynchronous operations.
Note that this feature is configurable and is disabled by default. Users must update the IO Monitor settings to enable it.
The Overview Section is divided into eight columns. From left to right, they are:
- Time
Stamp:The
Time Stamp column contains the time the message was sent.
- In some instances in the Windows product, there may also be:
- Program: The
program that originates the message.
- Address:
The logical addresses of the device.
- Source: The IO Library or driver that contains the function that generated the message. Messages from IVI-COM instrument drivers show IVI-COM in this column.
- Method Call:
The function that generated the message. For detailed information on specific function calls, refer to the Keysight VISA, SICL, and VISA-COM help files, or to the IVI-COM driver help file.
- IO Data:
The value of the first non-empty string parameter for the function call. The IO Data column monitors I/O string or other buffer data. VISA Resource Descriptors and SCPI commands are monitored in this column.
IO Monitor displays all VISA/SICL APIs handling data on a secure connection, while obscuring the content. With this update, the data sent or received is labeled as "<secure data>" in the overview section, and the data length is shown as "4294967295" in the detail section.
- Return Value:
The return value passed back from the function call. For detailed information on specific function calls and possible returned values, refer to the Keysight VISA, SICL, and VISA-COM help files, or to the IVI-COM driver help file. Please consult the Keysight VISA help file for a table containing all VISA Attributes along with their hexadecimal and decimal codes.
- Time (ms): The amount of time required to process the function call expressed in milliseconds. Examine the Time values to determine if any bottlenecks exist in your I/O code. For example, if one I/O operation takes much longer than the others, that operation may be a good place to begin studying your code. After you have adjusted the code, you can rerun the I/O application and examine its events to verify any improvements.
Detail Section
As shown above, the detail section shows the parameter(s) for the selected entry. The Parameters section has these columns:
- Name - The name of the parameter.
- Type - Whether the data is an input, output,
or return value, and the data type of the value.
- Value - The parameter value. IO Monitor displays all VISA/SICL APIs handling data on a secure connection, while obscuring the content. With this update, the data sent or received is labeled as "<secure data>" in the overview section, and the data length is shown as "4294967295" in the detail section.
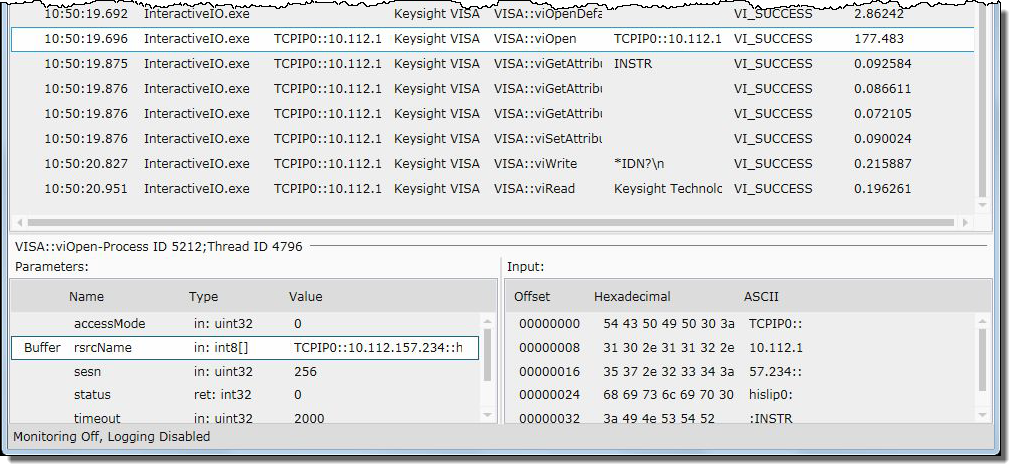
Buffer and array parameters are listed in blue text in the Parameters section. Click on one of these parameters to display the buffer or array details in the section to the right. The details for a buffer are:
- Offset - The buffer offset of the first value in the hexadecimal or ASCII column.
- Hexadecimal - The hexadecimal representation
of the buffer value.
- ASCII - The ASCII representation of the buffer value.
Arrays can contain 16-, 32-, or 64-bit data. The details for an array are:
For example, the graphic below (Windows is shown; Linux content is comparable) shows details of a buffer.
Status Bar
The status description at the bottom of the display alerts you to whether monitoring is on or off, and whether logging is enabled or disabled.
