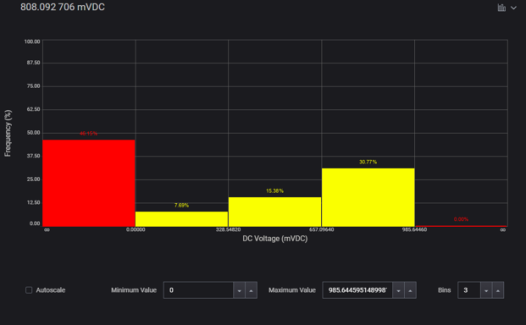
Histogram 
View data as a histogram. Groups are plotted on the horizontal axis (x-axis) using the units of measurement (volts, ohms, current, etc.), frequencies are plotted on the vertical axis (y-axis).
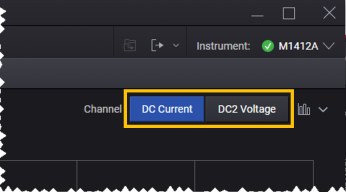
For multiple channels measurements, to view the data for the particular channel, select the channel from the boxes at the top right corner of the histogram.
Autoscale
When the check box is selected, all measurement data is automatically assigned to bins and displayed. When the check box is cleared, you can specify a Minimum Value and Maximum Value to be assigned to bins, and the number of bins (see below). Data outside of bins are shown in red.
Minimum Value
Specify the lowest measured value to include in the histogram. For example, 1 Vdc (for DC voltage measurements) or 20 Hz (for frequency measurements).
Maximum Value
Specify the highest measured value to include in the histogram. For example, 10 Vdc (for DC voltage measurements) or 200 Hz (for frequency measurements).
Bins
Set the number of bins (containers that accumulate data). Data outside of bins are shown in red.