Markers 
You can position the vertical (x-axis) marker pair to display measurement data for each marker position and display the measurement data between the markers.
If the markers are not being displayed on the line chart, click  to display them. To turn off the makers, click again.
Below is an example of a marker table from the Data Logger view.
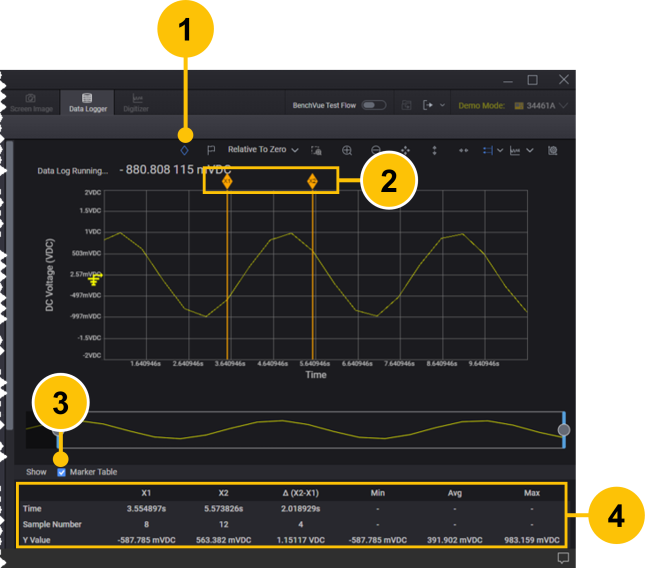
| 1 | Show vertical (X1 and X2) marker pair. Click again to hide the markers. | |
| 2 | Vertical Marker Pair (X1 and X2). Click at top of individual marker and drag left or right to the desired position on trace. At the point that each marker intersects the trace, the y-axis value (voltage, current, etc.) is measured. |
|
| 3 | Select the check box to show the Marker Table. | |
| 4 | The Marker Table shows the trace measurement data based on relative position of each marker. The delta measurements between the markers are calculated and are shown in the table as D(X2-X1). For the Data Logger view only, the minimum (Min), average (Avg), and maximum (Max) values between the markers are calculated. |