Overload Conditions
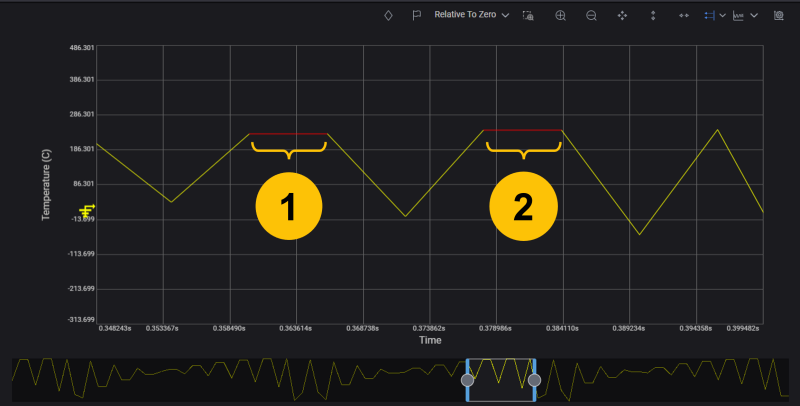
In line chart view, overload conditions are shown on the chart with a red trace color as shown in the example below.
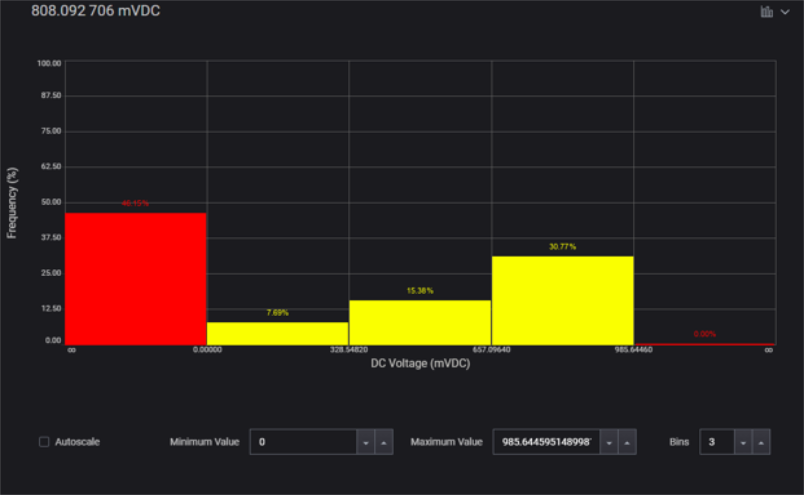
In histogram view, overload conditions are shown on the histogram with an outer bin to the right or to the left of the histogram. Outer bin is shown in red as shown in the example below.