Markers
Adjustable markers provide calculated measurements of the trace data between two points.
Using Horizontal Markers
Horizontal (y-axis) markers are only available in single trace view. Enabling the horizontal markers lets you measure the delta between the two markers for the trace in focus.
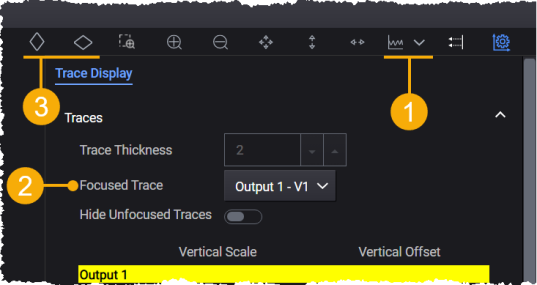
- Ensure single trace view
 is selected.
 - From the dropdown list, select the trace you want to calculate measurements for.
- Click
 to add the horizontal markers (Y1 and Y2) to the chart.
 - Select the Show checkbox to display the Marker Table.
- Use the mouse to drag the markers. The marker locations and calculated delta between the points are automatically updated in the Marker table.

In single trace view, both horizontal and vertical markers can be added.
Using Vertical Markers
Vertical (x-axis) markers are available in both multi-trace and single trace views. When vertical markers are enabled in multi-trace view, you can select the traces to use for measuring the delta between the two markers in the Marker table.
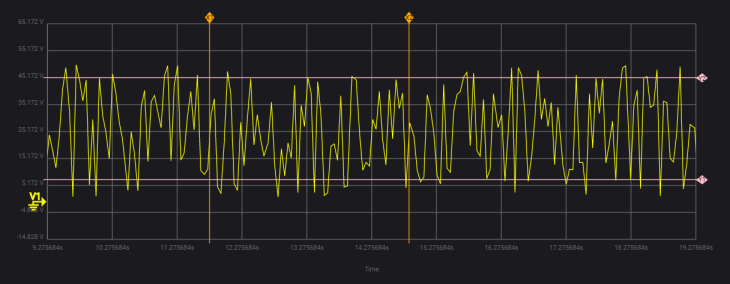
- Click
 to add the vertical markers (X1 and X2) to the chart.
 - Select the Show checkbox to display the Marker Table.
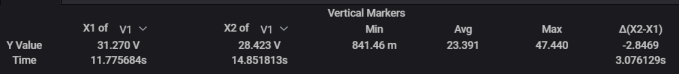
- In the table, select the traces from the dropdown lists (for example, V1).
- Use the mouse to drag the markers. The marker locations and calculated measurement between the points are automatically updated in the table. If the same trace is selected for both markers, the minimum, average, and maximum measurements are also updated.
Hiding Markers
Click ![]() or
or ![]() again to hide the markers.
again to hide the markers.