Trace Display Settings
Click ![]() to set the following:
to set the following:
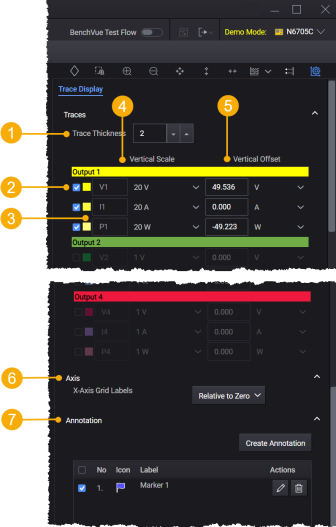
| 1 | The line thickness of the trace (1 to 5 pixels). |
| 2 | Click the checkboxes to select the traces to display for each output. By default, only Output 1 traces are shown. |
| 3 | Click the color box for a trace to display a color chart and select a different color for that trace. |
| 4 | The vertical scale for each trace. |
| 5 | The vertical offset between individual traces. |
| 6 | Select x-axis label – Relative to Zero (default), Date Time in local time, or Date Time (UTC) relative to Universal Time Coordinated time. |
| 7 | Create and include annotation to the chart. |
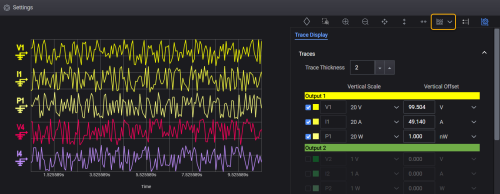
Multi-Trace View
Selected traces are displayed separately on the chart, as indicated by the View icon ![]() .
.
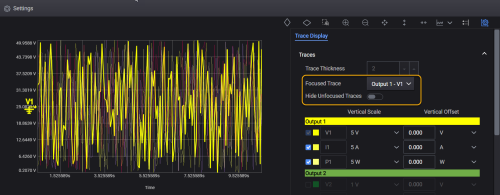
Single Trace View
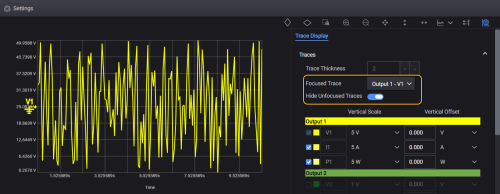
To focus on a single trace, select ![]() . You can select any trace to be the focus (V1 in the following example). You can also hide the unfocused traces in the background using the toggle button.
. You can select any trace to be the focus (V1 in the following example). You can also hide the unfocused traces in the background using the toggle button.
The following examples show the settings and corresponding trace displays.