The Discharge/Charge Operation
The Discharge/Charge Window
The Discharge Operation
Discharge Run Example
The Charge Operation
Charge Run Example
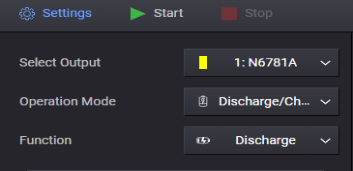
Select the Discharge/Charge operation from the Settings menu or Icon.
![]()
Then select whether you are performing a Discharge or Charge function.
The Discharge/Charge Window
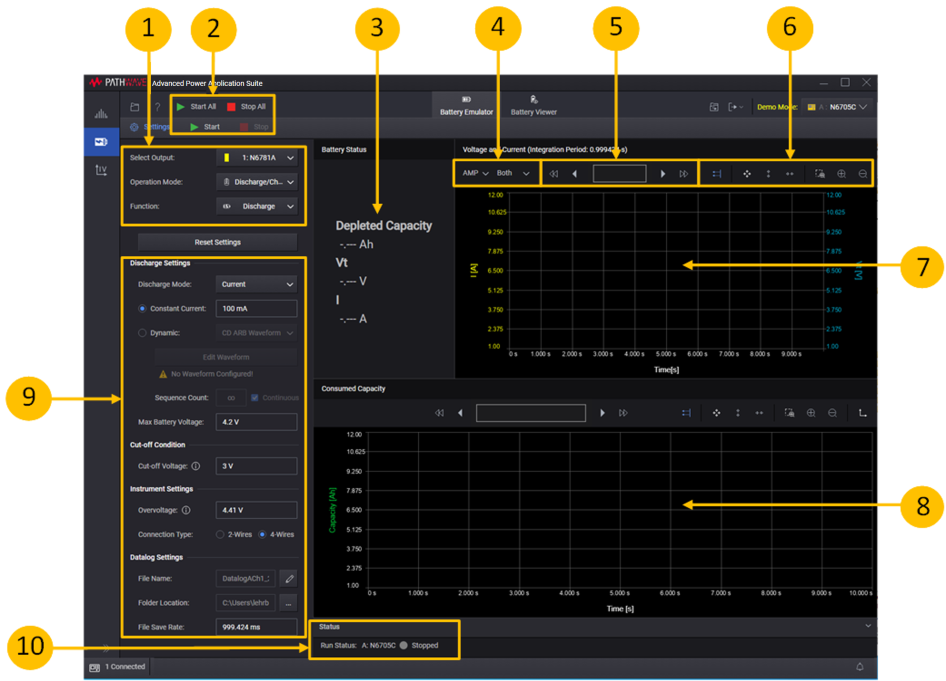
1. Settings area - lets you select the Discharge/Charge operation.
2. Start or Start All - click Start or Start All to start and display the discharge/charge graph of either the specified instrument output or all outputs.
3. Battery status - displays a "snapshot" of the battery parameters when the operation is run.
4. Graph settings - lets you specify additional graph settings (Ampere or Charge-rate; Current, Voltage, or Capacity).
5. Data Preview Bar - indicates the portion of the data that is visible on the graph.
6. Graph toolbars - lets you autoscale and zoom in or out of the display area.
7. Voltage and Current - charts the battery voltage and current of the operation. You can configure the Current axis to display either Amps or Charge rate.
8. Capacity - charts the capacity of the discharge or charge operation. You can configure the horizontal axis to display either state of charge in percent, or Capacity in Amp-hours.
9. Settings - specify the settings for the discharge or charge operation.
10. Run Status - displays the run status of the selected instrument outputs.
The Discharge Operation
The following steps describes the discharge operation.
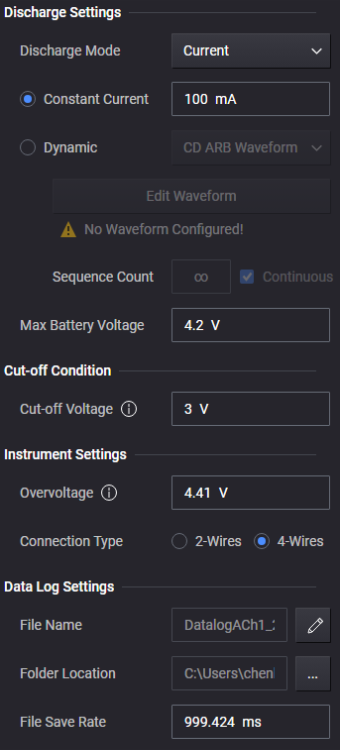
Step 1. In the Settings area on the left side of the window, specify the discharge settings.
Reset Settings – resets the settings to the default values.
Discharge Settings
Discharge Mode - specify the discharge operating mode: Current, Power, or Resistance (default = Current).
Constant Current - specify the steady-state discharge current.
Dynamic - lets you configure a dynamic discharge current waveform. There are three options for specifying dynamic currents:
1. CD ARB Waveform: Configure a new CD (constant dwell) waveform (see Create a CD Arb Waveform).
2. Load From Data Log: Load a datalog file from the Power Control and Analysis application. You can only import a datalog file containing one current trace (see Load From Data Log).
3. Load From File: Import an existing waveform file that has been created from the CD ARB waveform editor, or importing a current waveform that was created from a BV9200B or PW9252A output list editor (see Load a Current Waveform File).
Edit Waveform - When CD Arb Waveform is selected, opens the Edit Waveform dialog, which lets you configure a CD Arb waveform.
Sequence Count - lets you specify a repeat count for the waveform, or specify Continuous repeat.
Constant Power - specify the steady-state discharge power. The default value is 0 W. The range is from 0 W – the module's (maximum current rating) x (cut-off voltage).
Constant Resistance - specify the steady-state discharge resistance. The default is the maximum value.
Max Battery Voltage - specify the maximum voltage at the battery terminals.
Note The allowable voltage and current settings depend on the operating ranges of the instrument. For example, for the N6781A power module - if you program a voltage limit of 18 V, you cannot program a discharge current greater than 1 A. To program a current of 3 A, the voltage settings must be in the 6 V range.
Cut-off Condition
Cut-off Voltage - specify the discharge cut-off voltage.
Instrument Settings
OverVoltage - specify the discharge overvoltage limit. The default overvoltage value is set to the Max Battery Voltage setting +5%. However you have the option to change the overvoltage to a higher value. A status message will indicate that the overvoltage protection has been adjusted by the user.
Connection Type - specify the measurement connection type of the connected instrument (2- or 4-wire sensing).
Data Log Settings
A data log of the voltage and current measurements of the existing operation is automatically generated when the operation is started.
File Name - specify the filename of the data log.
Folder Location - select the folder location of the data log.
File Save Rate - specify the rate at which data is saved to a file. If the rate is 1 s, measurement data is saved once every second. The file save rate must be divisible by the instrument's integration period. When you change the file save rate, you will also change the integration period of the measurement. This will be displayed at the top of the Voltage and Current graph "Voltage and Current Integration Period: 999.8336 ms".
Step 2. When you select Start, the discharge waveform will be displayed in the Discharge display.
Step 3. When you exit the Discharge window the discharge waveform will automatically be available and loaded into the Emulation Operation.
Discharge Run Example
The following example describes the information that appears on the display when a discharge operation is run. Refer to Starting and Stopping for more information.
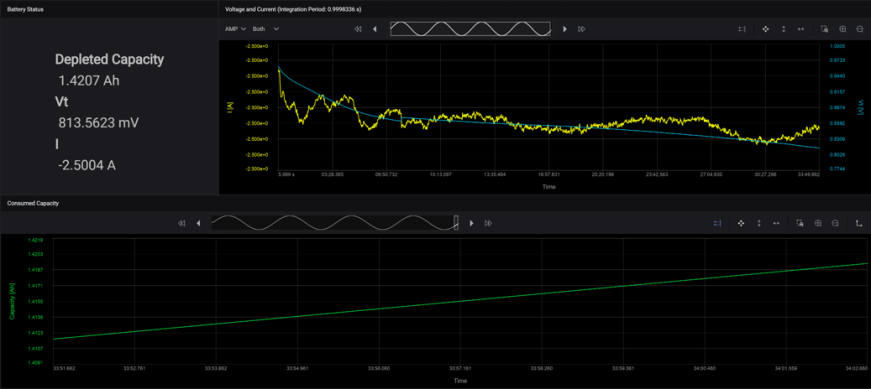
Battery Status - The Battery status area displays the running state of the battery as it is being discharged. Consumed Capacity is the energy in Amp hours that is consumed by the load as the battery is being discharged. Vt indicates the battery terminal voltage during the discharge operation. I indicates the current that is being discharged throughout the discharge operation.
Voltage and Current - The Voltage and Current graph displays the battery discharge profile that is generated during the discharge operation. The voltage and current points at the specified integration period are displayed on the graph. Note that the current is being discharged at the specified rate of 1 A. The voltage of the battery decreases as the discharge operation continues.
Consumed Capacity - The Consumed Capacity graph displays a visual representation of the consumed discharge capacity by the load during the duration of the discharge operation.
The Charge Operation
The following steps describes the charge operation.
Step 1. In the Settings area on the left side of the window, specify the charge settings.
|
CC mode settings 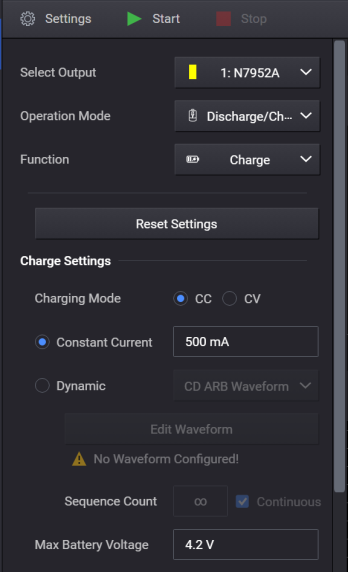
|
CV mode settings 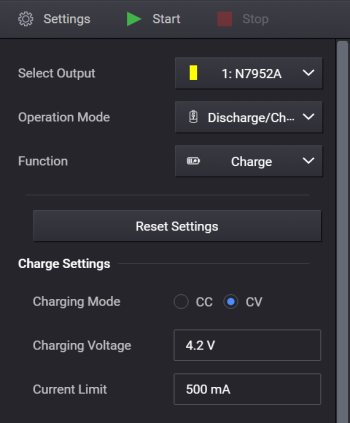
|
Reset Settings – resets the settings to the default values.
Charge Settings - lets you specify the settings for the charge operation:
Charging Mode - displays the charge operating mode (default = CC, constant current).
Constant Current - specify the charge current (applies in CC mode).
Dynamic - lets you configure a dynamic discharge current waveform. There are three options for specifying dynamic currents:
1. CD ARB Waveform: Configure a new CD (constant dwell) waveform (see Create a CD Arb Waveform).
2. Load From Data Log: Load a datalog file from the Power Control and Analysis application. You can only import a datalog file containing one current trace (see Load From Data Log).
3. Load From File: Import an existing waveform file that has been created from the CD ARB waveform editor, or importing a current waveform that was created from a BV9200B output list editor (see Load a Current Waveform File).- specify the charge current (applies in CC mode).
Edit Waveform - When CD Arb Waveform is selected, opens the Edit Waveform dialog, which lets you configure a CD Arb waveform.
Sequence Count - lets you specify a repeat count for the waveform, or specify Continuous repeat.
Max Battery Voltage - specify the maximum voltage at the battery terminals (applies in CC mode).
Charging Voltage - specify the charge voltage (applies in CV mode).
Current Limit - specify the high-current limit for charge operation (applies in CV mode).
Note The allowable voltage and current settings depend on the operating ranges of the instrument. For example, for the N6781A power module - if you program a voltage limit of 18 V, you cannot program a charge current or current limit greater than 1 A. To program a current of 3 A, the voltage settings must be in the 6 V range.
Cut-off Condition
Battery Type - specify the battery type, either Li-ion or Others.
Configure the Li-ion battery cut-off condition as follows.
Condition Type - specify either voltage or current cut-off conditions.
Stopping Current - specify the stopping current value. When the battery’s voltage reaches the max battery voltage value, the current drops in CC mode charging. When the dropping current reaches the stopping current value, the charging operation is complete and the process will stop.
Stopping Voltage - specify the stopping voltage value. When the battery’s voltage reaches the stopping voltage value, the charging operation will stop regardless of the measured current value.
Configure the Others battery cut-off condition as follows.
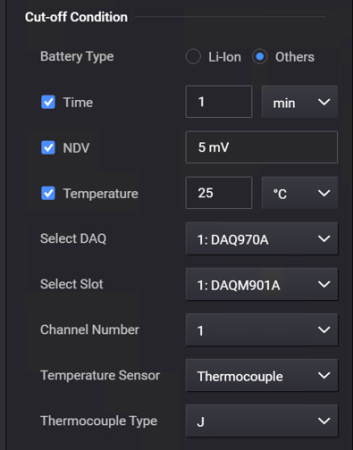
Battery Type - Others
You must select at least one of the following three cut-off conditions.
Time - specify the elapsed time after which the charge operation will stop. A drop-down menu lets you specify the cut-off time in seconds, minutes, hours, or days.
NDV - the negative delta value (NDV) specifies the maximum negative voltage drop that stops the charging operation.
Temperature - enter the ambient temperature limit that stops the charging operation. Specify either Celsius or Fahrenheit in the dropdown. The default value is 25°C, with a range from 0°C to 100°C (32°F – 212°F)
The following selections are only available if Temperature has been checked, and if there is DAQ connected to the application.
Select DAQ - select any connected DAQ instrument to perform temperature measurements.
Select Slot - select any available DAQ slot where a temperature sensor is connected to measure ambient temperature.
Channel Number - select any DAQ Channel Number that has a temperature sensor connected to measure ambient temperature. You cannot select the DAQ channel number as an Output channel.
Temperature Sensor - select either Thermocouple or Thermistor temperature sensor.
Thermocouple Type - specify the thermocouple type from the dropdown list.
Thermistor Type - specify the thermistor type from the dropdown list.
Instrument Settings
OverVoltage - specify the charge overvoltage limit. The default overvoltage value is set to the Max Battery Voltage setting +5%, or Charging Voltage setting +5%. However you have the option to change the overvoltage to a higher value. A status message will indicate that the overvoltage protection has been adjusted by the user.
OverCurrent - enables overcurrent protection (applies in CV mode).
Connection Type - specify the measurement connection type of the connected instrument (2- or 4-wire sensing).
Data Log Settings
A data log of the voltage and current measurements of the existing operation is automatically generated when the operation is started.
File Name - specify the filename of the data log.
Folder Location - select the folder location of the data log (default location= Keysight\BenchVue\Advanced Battery Test and Emulation\Data Logs).
File Save Rate - specify the rate at which data is saved to a file. If the rate is 1 s, measurement data is saved once every second. The file save rate must be divisible by the instrument's integration period.
Step 2. When you select Start, the charge waveform will be displayed in the Charge display.
Step 3. When you exit the Charge window the charge waveform will automatically be available and loaded into the Emulation Operation.
Charge Run Example
The following example describes the information that appears on the display when a charge operation is run. Refer to Starting and Stopping for more information.
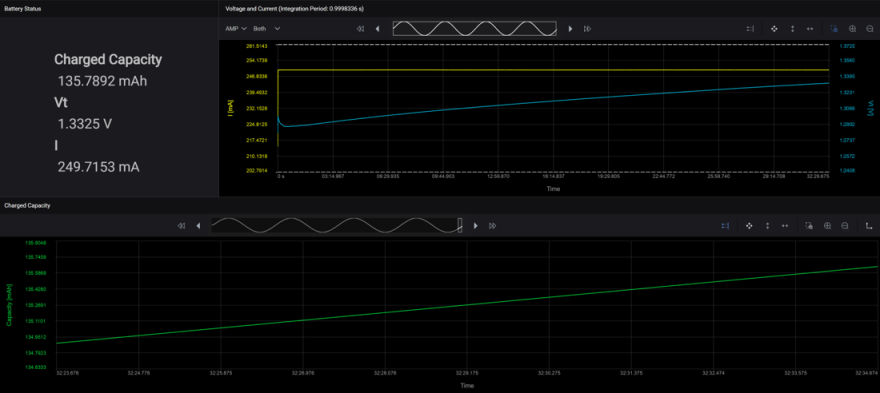
Battery Status - The Battery status area displays the running state of the battery as it is being charged. Charged Capacity is the energy in Amp hours that is consumed by the battery as it is being charged. Vt indicates the battery terminal voltage during the charge operation. I indicates the current that is being charged throughout the charge operation.
Voltage and Current - The Voltage and Current graph displays the battery charge profile that is generated during the charge operation. The voltage and current points at the specified integration period are displayed on the graph. Note that the current is being charged at different values throughout the charge cycle based on the physical characteristics of the battery. The voltage of the battery increases as the charge operation continues. The charging current is limited at the Current Limit value in CV mode. The battery voltage is limited at the Voltage Limit value in CC mode.
Charged Capacity - The Charged Capacity graph displays a visual representation of the charged state of the battery during the duration of the charge operation.