Profiler Operation
Profiler Window
Discharge Profiler Operation
Discharge Profiler Run Example
Charge Profiler Operation
Charge Profiler Run Example
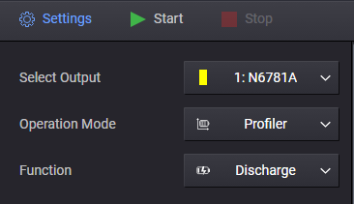
Select the Profiler operation mode from the Settings panel or the Profiler icon in the display area. Then select Discharge or Charge function.
![]()
or
Profiler Window
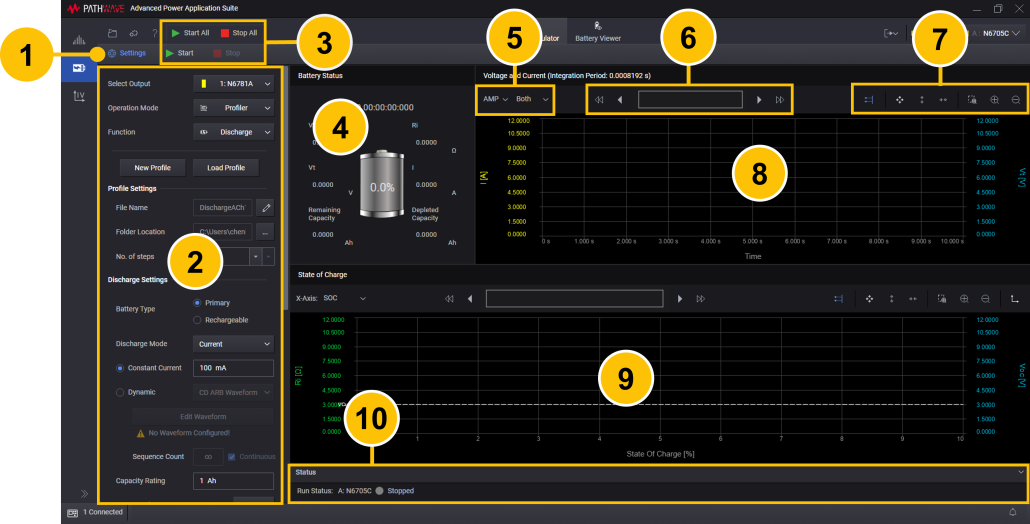
| 1 | Show or hide the Settings panel. | |
| 2 | Select the Profiler operation mode, specify the settings for the new profile, or adjust the settings of the existing profile. |
|
| 3 | Start/Stop - Start or stop display of the profile of the specified instrument output. Start All/Stop All - Start or stop display of the profile of all outputs. |
|
| 4 | Show the battery status. Display a "snapshot" of the battery parameters when the profile is run. | |
| 5 | Specify additional graph settings (Ampere, Charge-rate; Current, Voltage, or Both). | |
| 6 | Show portion of data currently displayed on chart above. See Data Preview Bar. | |
| 7 | Use Graph Toolbar to zoom in/out and auto scale the displayed data. | |
| 8 | Display the battery voltage and current of the profiler operation in a chart. You can configure the Current axis (y-axis) to display either Amps or Charge rate. | |
| 9 | Display the state of charge of the profiler operation in a chart. You can configure the horizontal axis (x-axis) to display either state of charge in percent, or Capacity in Amp-hours. | |
| 10 | Display the run status of the selected instrument outputs. |
Discharge Profiler Operation
The following steps describe the discharge profile operation.
Step 1. In the Settings panel on the left side of the window, select Discharge function and specify the discharge profile settings.
New Profile - Configure a new profile.
Load Profile - Load an existing profile. Select the directory where the profile is located. This provides flexibility in that you can save battery test data into a profile at each SOC percentage level. For example, if you decide to stop the test after reaching certain SOC percentage, the data can first be saved into a profile. The same profile can be reloaded to resume testing at a different SOC level. This stop and resume profiling feature also applies when resting the battery during the discharging operation.
Profile Settings - Lets you specify the new profile name, location, and number of steps:
File Name - Specify the file name of the new profile.
Folder Location - Select the folder location of the new profile.
No. of steps - Set the number of discharge profile steps. The minimum is 100 and the maximum is 200 (default = 200).
Discharge Settings - Lets you specify the settings for the new profile, or adjust the settings of the existing profile:
Battery Type - Specify the battery type: Primary (non-rechargable) or Rechargeable (default = Primary).
Discharge Mode - Specify the discharge operating mode: Current, Power, or Resistance (default = Current).
Constant Current - Specify the steady-state discharge current.
Dynamic - Configure a dynamic discharge current waveform. There are three options for specifying dynamic currents:
1. CD ARB Waveform - Configuring a new CD (constant dwell) waveform (see Create a CD Arb Waveform.)
2. Load From Data Log - Load a data log file from the Power Control and Analysis application. You can only import a data log file containing one current trace (see Load From Data Log).
3. Load From File - Import an existing waveform file that has been created from the CD ARB waveform editor, or importing a current waveform that was created from a BV9200B or PW9252A output list editor (see Load a Current Waveform File).
Edit Waveform - When CD ARB Waveform is selected, opens the Edit Waveform dialog, which lets you configure a CD Arb waveform.
Sequence Count - Specify a repeat count for the waveform, or specify Continuous repeat.
Constant Power - Specify the steady-state discharge power. The default value is 0 W. The range is from 0 W – the module's maximum power rating.
Constant Resistance - Specify the steady-state discharge resistance. The default is the maximum value.
Capacity Rating - Specify the capacity of the discharge profile.
Battery Voltage - Click the Measure to display the actual battery voltage.
Current Pulse Width - Specify the pulse width of the discharge current pulse when the current is temporarily set to discharge current to measure Vl (load voltage).
Rest Time - Specify the rest time between pulses, when the discharge current is zero to measure Voc (open-circuit voltage).
Cut-off Condition
Condition Type - Specify either Cut-Off Voltage or Consumed Capacity.
Cut-off Voltage Type - Set to open-circuit voltage (VoC) or a voltage limit value (VL).
Consumed Capacity - Specify the consumed discharge capacity cut-off limit of the battery in amp-hours.
Cut-off Voltage - Specify the discharge cut-off voltage.
Instrument Settings
Connection Type - Specify the measurement connection type of the connected instrument (2- or 4-wire sensing).
Temperature Monitor Settings
Ambient Temperature - Toggle to turn temperature settings On or Off.
Source - Specify Constant Temperature or From DAQ. If Constant Temperature is specified. you must enter the ambient temperature of the battery location
Temperature - Enter the ambient temperature of the battery location. Specify Celsius (°C) or Fahrenheit (°F) from the drop-down list. The default value is 25°C, with a range from 0°C to 100°C (32°F – 212°F)
The From DAQ source selection is only available if there is DAQ connected to the application. Configure the DAQ instrument settings as follows.
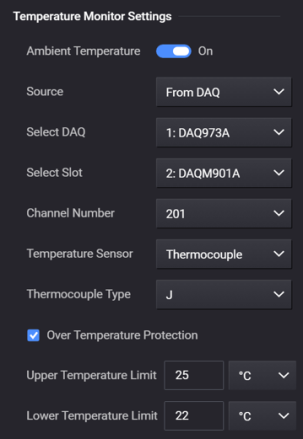
Ambient Temperature - Switch to On.
Source - Select From DAQ.
Select DAQ - Select any connected DAQ instrument to perform temperature measurements.
Select Slot - Select any available DAQ slot where a temperature sensor is connected to measure ambient temperature.
Channel Number - Select any DAQ channel number that has a temperature sensor connected to measure ambient temperature.
Temperature Sensor - Select Thermocouple, RTD, or Thermistor temperature sensor.
Thermocouple Type - Specify the thermocouple type from the drop-down list.
Thermistor Type - Specify the thermistor type from the drop-down list.
Over Temperature Protection - Select the check box to enable over temperature protection.
Upper Temperature Limit - Specify the upper temperature limit. This upper limit acts as a stopping value. When the discharge operation starts and the temperature captured from the DAQ exceeds this limit value, the battery operation will automatically stop.
Lower Temperature Limit - Specify the lower temperature limit. This lower limit acts as a stopping value. When the discharge operation starts and the temperature captured from the DAQ is below this limit value, the battery operation will automatically stop.
Data Log Settings - A data log of the voltage and current measurements of the existing operation is automatically generated when the operation is started.
File Name - Specify the file name of the data log.
Folder Location - Select the folder location of the data log.
File Save Rate - Specify the rate at which data is saved to a file. If the rate is 1 s, measurement data is saved once every second. The file save rate must be divisible by the instrument's integration period. This will be displayed at the top of the Voltage and Current chart. For example, "Voltage and Current (Integration Period: 999.8336 ms)".
Step 2. When you click Start, the discharge waveform will be displayed in the profile display.
Step 3. When you exit the Profiler window the profile is saved in the directory under the file name that you specified in the Profile Settings.
Discharge Run Example
The following example describes the information that appears on the display when a discharge profiler is run. Refer to Starting and Stopping for more information.
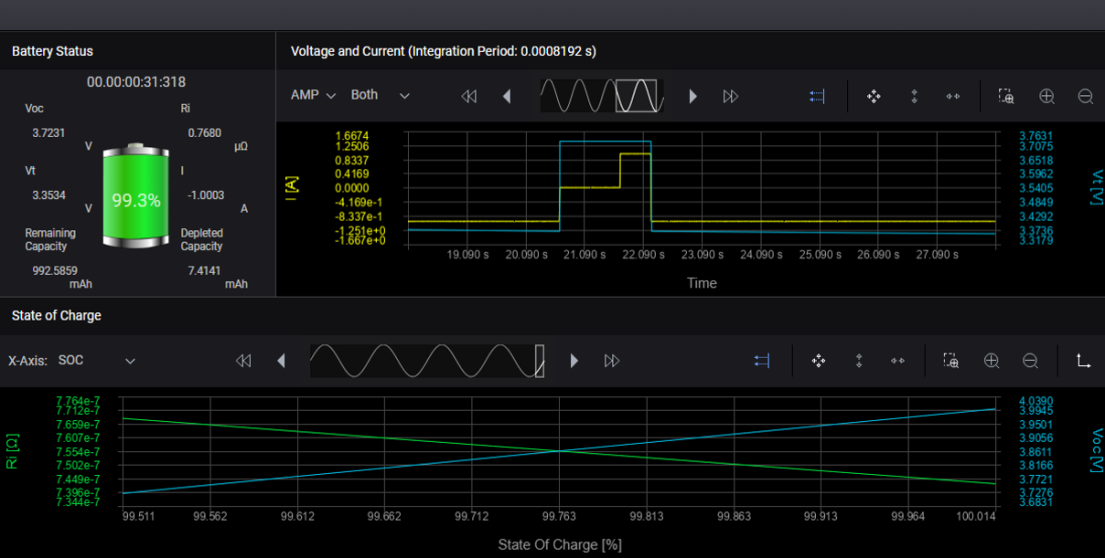
Battery Status - The Battery Status area displays the running state of the battery as it is being discharged.
Voc - The open-circuit voltage of the battery during the discharge operation.
Ri - The calculated internal resistance of the battery during the discharge operation.
Vt - Indicate the battery terminal voltage during the discharge operation.
I - Indicate the current that is being discharged throughout the discharge operation.
Depleted Capacity - The energy in milli-Amp hours that has been consumed by the load as the battery is being discharged.
Remaining Capacity - The capacity in milli-Amp hours still remaining in the battery as it is being discharged.
Voltage and Current - The Voltage and Current chart displays the battery discharge profile that is being used during the discharge operation. The voltage and current data are displayed on the chart at the specified integration period. The voltage data is superimposed over the current data. The current is being discharged at the specified rate of -1 A, as shown right beside the battery display.
In addition to amperes (AMP), you can also select C-Rate from the drop-down list, which plots the current data in Coulombs.
State of Charge - The State of Charge chart displays the open-circuit voltage and the calculated internal resistance of the battery during the discharge operation. The state of charge is represented in percent on the x-axis. You can also select Capacity from the drop-down list, which plots the Voc and Ri traces based on the remaining capacity (when discharging) or consumed capacity (when charging).
Charge Profiler Operation
The following steps describe the charge profile operation.
Step 1. In the Settings panel on the left side of the window, select Charge function and specify the charge settings.
New Profile - Configure a new profile.
Load Profile - Load an existing profile. Select the directory where the profile is located. This provides flexibility in that you can save battery test data into a profile at each SOC percentage level. For example, if you decide to stop the test after reaching certain SOC percentage, the data can first be saved into a profile. The same profile can be reloaded to resume testing at a different SOC level. This stop and resume profiling feature also applies when resting the battery during the charging operation
Profile settings - Lets you specify the new profile name, location, and number of steps:
File Name - Specify the file name of the new profile.
Folder Location - Select the folder location of the new profile.
No. of steps - Set the number of charge profile steps. The minimum is 100 and the maximum is 200 (default = 200).
Charge Settings - Lets you specify the settings for the new profile, or adjust the settings of the existing profile:
Charging Mode - Display the charge operating mode (default = CC, constant current).
Current - Specify the charge current.
Max Charge Voltage - Specify the maximum charge voltage for the charge profile.
Capacity Rating - Specify the capacity of the charge profile amp-hours.
Battery Voltage - Click the Measure to display the actual battery voltage.
Current Pulse Width - Specify the pulse width of the charge current pulse when the current is temporarily set to charge current to measure Vl (load voltage).
Rest Time - Specify the rest time between pulses, when the charge current is zero.
Cut-off Condition
Battery Type - Specify the battery type (Li-ion, Others).
Configure the Li-ion battery cut-off condition as follows.
Condition Type - Specify Stopping Current, Charged Capacity, or Both condition.
Stopping Current - Specify the stopping current value. When the battery’s voltage reaches the max battery voltage value, the current drops in CC mode charging. When the dropping current reaches the stopping current value, the charging operation is complete and the process will stop.
Charged Capacity - Specify the charged capacity of the battery in amp-hours.
Configure the Others battery cut-off condition as follows. You must select at least one of the following three cut-off conditions.
Time - Specify the elapsed time after which the charge operation will stop. A drop-down menu lets you specify the cut-off time in seconds, minutes, hours, or days.
NDV - The negative delta value (NDV) specifies the maximum negative voltage drop that stops the charging operation.
Temperature - Enter the ambient temperature limit that stops the charging operation. Specify either Celsius or Fahrenheit in the drop-down list. The default value is 25°C, with a range from 0°C to 100°C (32°F – 212°F). This option is only available when there is DAQ connected to the application.
The following options are only available if Temperature has been selected (with DAQ instrument is connected).Select DAQ - Select any connected DAQ instrument to perform temperature measurements.
Select Slot - Select any available DAQ slot where a temperature sensor is connected to measure ambient temperature.
Channel Number - Select any DAQ channel number that has a temperature sensor connected to measure ambient temperature. You cannot select the DAQ channel number as an Output channel.
Temperature Sensor - Select Thermocouple, RTD, or Thermistor temperature sensor.
Thermocouple Type - Specify the thermocouple type from the drop-down list.
Thermistor Type - Specify the thermistor type from the drop-down list.
Instrument Settings
Connection Type - Specify the measurement connection type of the connected instrument (2- or 4-wire sensing).
Temperature Monitor Settings
Ambient Temperature - Toggle to turn temperature settings On or Off.
Source - Specify Constant Temperature or From DAQ. If Constant Temperature is specified. you must enter the ambient temperature of the battery location
Temperature - Enter the ambient temperature of the battery location. Specify Celsius (°C) or Fahrenheit (°F) from the drop-down list. The default value is 25°C, with a range from 0°C to 100°C (32°F – 212°F)
The From DAQ source selection is only available if there is DAQ connected to the application. Configure the DAQ instrument settings as follows.
Ambient Temperature - Switch to On.
Source - Select From DAQ.
Select DAQ - Select any connected DAQ instrument to perform temperature measurements.
Select Slot - Select any available DAQ slot where a temperature sensor is connected to measure ambient temperature.
Channel Number - Select any DAQ channel number that has a temperature sensor connected to measure ambient temperature.
Temperature Sensor - Select Thermocouple, RTD, or Thermistor temperature sensor.
Thermocouple Type - Specify the thermocouple type from the drop-down list.
Thermistor Type - Specify the thermistor type from the drop-down list.
Over Temperature Protection - Select the check box to enable over temperature protection.
Upper Temperature Limit - Specify the upper temperature limit. This upper limit acts as a stopping value. When the discharge operation starts and the temperature captured from the DAQ exceeds this limit value, the battery operation will automatically stop.
Lower Temperature Limit - Specify the lower temperature limit. This lower limit acts as a stopping value. When the discharge operation starts and the temperature captured from the DAQ is below this limit value, the battery operation will automatically stop.
Data Log Settings - A data log of the voltage and current measurements of the existing operation is automatically generated when the operation is started.
File Name - Specify the file name of the data log.
Folder Location - Select the folder location of the data log.
File Save Rate - specify the rate at which data is saved to a file. If the rate is 1 s, measurement data is saved once every second. The file save rate must be divisible by the instrument's integration period. This will be displayed at the top of the Voltage and Current chart. For example, "Voltage and Current (Integration Period: 999.8336 ms)".
Step 2. When you click Start, the charge waveform will be displayed in the profile display.
Step 3. When you exit the Profiler window the profile is saved in the directory under the file name that you specified in the Profile Settings.
Charge Profiler Run Example
The following example describes the information that appears on the display when a charge profile is run. Refer to Starting and Stopping for more information.
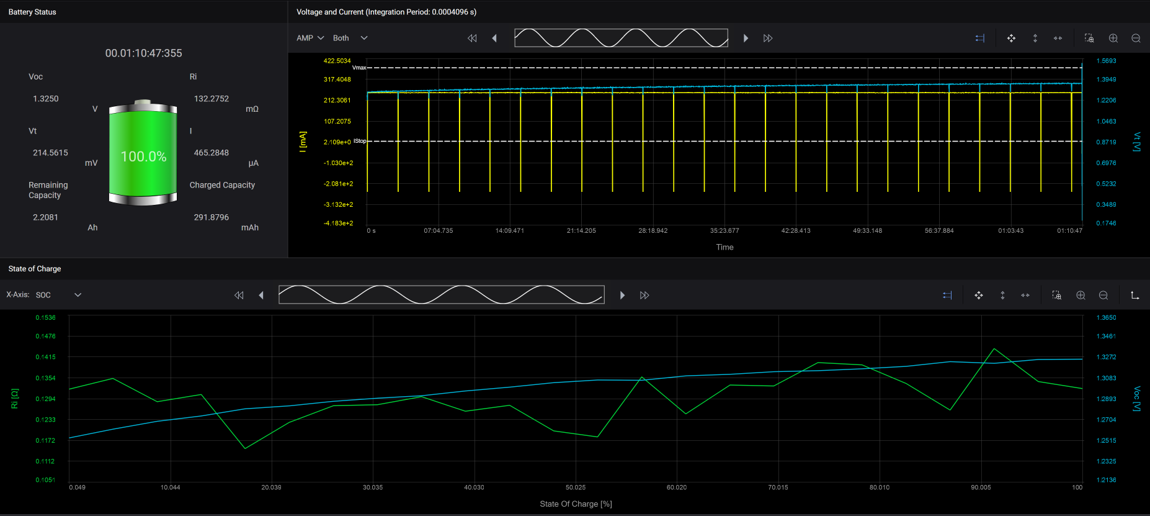
Battery Status - The Battery Status area displays the running state of the battery as it is being charged.
Voc - The open-circuit voltage of the battery during the charge operation.
Ri - The calculated internal resistance of the battery during the charge operation.
Vt - Indicate the battery terminal voltage during the charge operation.
I - Indicate the current that is being charged throughout the charge operation.
Charged Capacity - The energy in milli-Amp hours that has been consumed by the battery as it is being charged.
Remaining Capacity - The capacity in milli-Amp hours remaining that still needs to be charged.
Voltage and Current - The Voltage and Current chart displays the battery charge profile that is being used during the charge operation. The voltage and current data are displayed on the chart at the specified integration period. The voltage data is superimposed over the current data. The current is being charged at the specified rate of 0.3 A, as shown on the chart.
In addition to amperes (AMP), you can also select C-Rate from the drop-down list, which plots the current data in Coulombs.
The yellow line is the Istop value, which is set to -0.5 mA. This is because the battery will charge at very low current when the battery is almost fully charged. The stop-charging current value is set to a value slightly less than the low current charging value.
State of Charge - The State of Charge chart displays the open-circuit voltage and the calculated internal resistance of the battery during the charge operation. The state of charge is represented in percent on the x-axis. You can also select Capacity from the drop-down list, which plots the Voc and Ri traces based on the remaining capacity (when discharging) or consumed capacity (when charging).