Graph View 
Click the IV Curve tab to show the graph view for the last measured data.
The following window shows the various controls of the Graph view window.
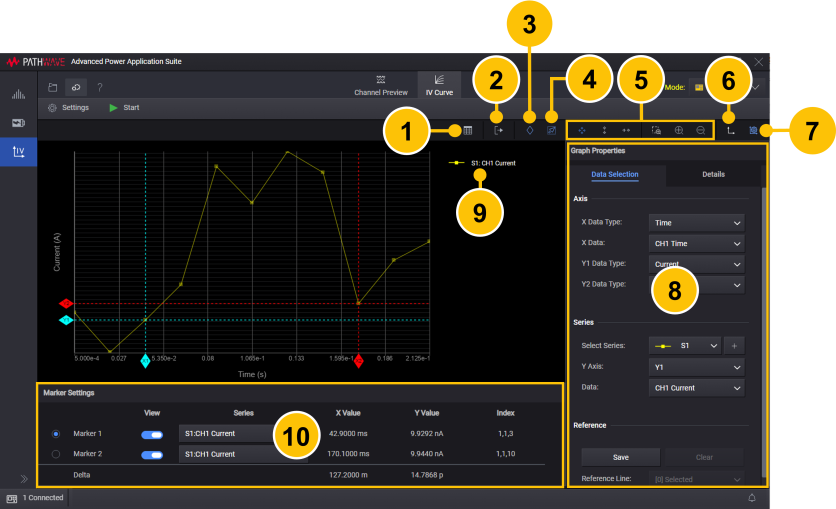
- Access Table View dialog.
- Export Graph.
- Access Marker panel.
- Enable/disable cursor on graph.
- Trace display toolbar.
 - Toggle all axis to auto scale in x and y direction.
 - Auto scale vertically.
 - Auto scale horizontally.
 - Zoom by region. When toggled, lets you zoom to selected region on the graph (otherwise, use the mouse wheel to zoom-in or -out)
 - Zoom in.
 - Zoom out.
 - Toggle to invert all axis.
- Access graph properties panel.
- Graph properties panel with data selection and details tab.
- Graph legend, editable through graph properties panel details graph.
- Marker panel.
Select the axis types, series, and reference line status on the Data Selection tab (#8).
Graph View supports the following functions:
- Add any number-series (X/Y plot lines).
- The number of reference lines will equal the number-series added.
- Two Y-axes (Y1/Y2 axis).
- X/Y axes logarithm scale (refer to Details tab #8).
- Marker function (#10).
- Scaling function (refer to Details tab #8).
- Export graph function (#2).
- Save or clear reference data.
Graph Properties - Data Selection
The Data Selection tab quickly sets the plot lines for all series and reference line status.
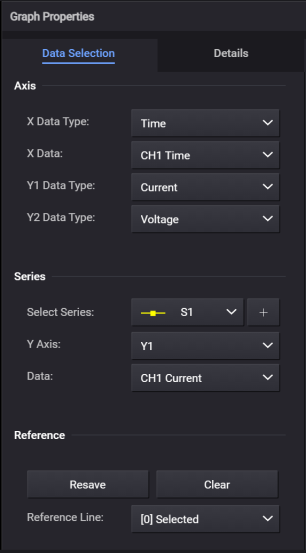
Axis Group
| X Data Type | Select the data type to be assigned to the X axis from the following list: Time Assign timestamp data to the X axis. Voltage Assign voltage data to the X axis. Current Assign current data to the X axis. Source Assign source data to the X axis. Formula Assign formula (arithmetic operation result) data to the X axis. Any Assign multiple data type to the X axis. You can set different data types to the X axis in Details Setting. |
| X Data | Select the X data. This combo box shows a list of X Data Type data. If multiple channel data exist, you can select "Depend Y Data". When "Depend Y Data" is selected, the X axis data is automatically set to X Data Type data for the Y data channel. For example, if the X Data Type is Time and the Y data is CH2 Current, CH2 Time will be selected as the X Data. |
| Y1 Data Type | Select the data type to be assigned to the y1 axis from the following list:
Voltage Assign voltage data to the y1 axis. Current Assign current data to the y1 axis. Resistance Assign resistance data to the y1 axis. Power Assign power data to the y1 axis. Source Assign source data to the y1 axis. Formula Assign formula (arithmetic operation result) data to the y1 axis. Any Assign multiple data type to the y1 axis. You can set different data types to the y1 axis in Details Setting. |
| Y2 Data Type | Select the data type to be assigned to the y2 axis from the following list:
Voltage Assign voltage data to the y2 axis. Current Assign current data to the y2 axis. Resistance Assign resistance data to the y2 axis. Power Assign power data to the y2 axis. Source Assign source data to the y2 axis. Formula Assign formula (arithmetic operation result) data to the y2 axis. Any Assign multiple data type to the y2 axis. You can set different data types to the y2 axis in Details Setting. |
Series Group
| Select Series | Selects the current active series. This combo box shows a list of all added series. You can add extra series using the + button. |
| Y Axis | Selects the Y axis for current selected series: Y1 Assign the Y1 axis. Y2 Assign the Y2 axis. |
| Data | Selects the Y data. This combo box shows a list of Y1 or Y2 Data Type data ( depending on the Y Axis selection ). If the Y1 or Y2 Data Type is set to "Any", all Voltage, Current, Resistance, Power, Time, Source, and Formula names will be listed. To disable the XY plot line, select "Not Set". |
Reference Group
| Resave/Save | Resave overwrites saved reference data. This selection is only available when reference data is saved. Save creates a snapshot of the current data and saves it as reference data. This selection is only available when no reference data is saved. |
| Clear | Clears reference data if there is any reference data saved. . |
| Reference Line | Shows/hides the reference line. This combo box displays all reference line. The number of reference line will tally with the number of series. |
Graph Properties - Details
The Details tab sets the details for the graph view.
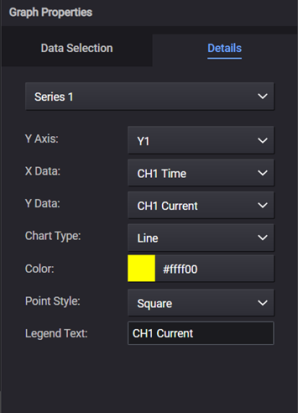
Series 1 Group
| X Axis | Sets X axis properties |
| Y1 Axis
Y2 Axis |
Sets Y axis properties |
| Reference N | Sets reference line properties . |
| Series N | Sets series properties |
| Marker 1
Marker 2 |
Sets marker properties |
| Legend | Sets the legend |
| Title | Sets the title |
| Color | Sets the color |
X/Y1/Y2 Axis
| Axis Title Text | Sets the X/Y1/Y2 axis title text.
This text is automatically set, when the X/Y1/Y2 Data Type is selected in Data Selection tab. To change the X/Y1/Y2 axis title, change this parameter. |
| Log Scale | Checked : Log scale
Not checked : Linear scale |
| Inverted | Inverts the axis polarity. |
| Auto scale | Checked : Auto scale
Not checked : Manual scale For manual scale, the minimum/maximum value is set to the value in the Min/Max text box value. |
| Min | Available only when auto scale is unchecked. Sets the minimum value for the axis. Input the minimum value. |
| Max | Available only when auto scale is unchecked. Sets the maximum value for the axis. Input the maximum value. |
Marker 1~2
| Color | Selects the marker color.
Default setting : Marker1= Turqoise, Marker2=Red. |
| Stroke Thickness | Sets the marker stroke size. |
Title
| Visible | Shows/hides the title ( default is false=hide ). |
| Text | Sets the title text. |
Legend
| Visible | Shows/hides the legend. |
| Legend Position | Legend Position |
| Show on Graph | Show legend on Graph |
Series N and Reference N
| Visible | Shows or hides the reference line. Only applies to Reference N |
| Y Axis | Selects the Y axis for the series.
This parameter is the same as the Y Axis parameter in Data Selection tab. |
| X Data
|
Selects the X data. By using this field, any data can be assigned as the X data. |
| Y Data | Selects the y data. By using this field, any data can be assigned as the y data. |
| Chart Type | Selects the chart type:
Point style Line: (default) |
| Color | Selects the line/point color. The default color depends on the series number. |
| Point Style | Selects the point style.
When the Chart Type is line, "None" will hide the points. When the Chart Type is point, "None" will use the default point style (square). . |
| Legend Text | Sets the series legend text.
The data name is used as the legend text by default. |
Color in Preset Mode
| Mode | Selects Preset or Detail mode. |
| Color Style | Selects the color style: Black - the background color is black (default) White - the background color is white |
Color in Detail Mode
| Mode | Selects Preset or Detail mode. |
| Background Color | Selects the background color ( background does not include plot area ). |
| Plot Area Color | Selects the plot area color. |
| Axis Color | Selects the axis color. |
| Grid Line Color | Selects the grid line color |
| Font Color | Selects the font color |
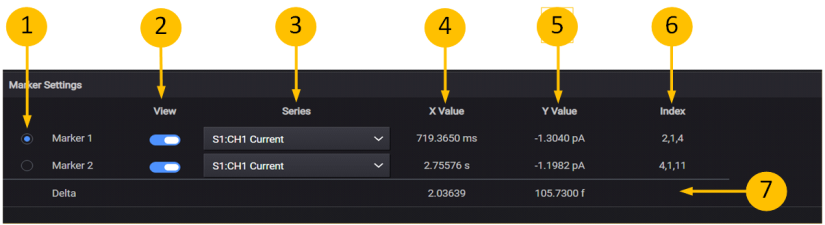
Marker Settings
The following describes the marker settings:
-
Focuses is on the current marker. Focused marker can be moved by mouse. The following operations are valid:
• Clicking the Plot Area moves the active marker to nearest data point of the target series.
• Click and Dragging in the Plot Area moves the active marker to nearest data point of the target series while dragging.
• Click and Dragging the diamond marker annotation moves the active marker to nearest X or Y data point of the diamond marker annotation while dragging.
 -
Shows/hides the marker in the Graph.
-
Selects the series that the marker focuses on.
-
The X value for current marker position.
-
The y value for current marker position.
-
The Index of current marker position.
-
The difference between marker 2 and marker 1 for X and Y value.
When the graph view is updated and a series line is shifted, the marker will not trace the moved measurement point. After the graph view is changed, click the plot area to move the marker to the measurement point.