Table View
Table view is accessed through the table ![]() button in the Graph View (see #1).
button in the Graph View (see #1).
Table settings can be accessed through the gear ![]() button
button
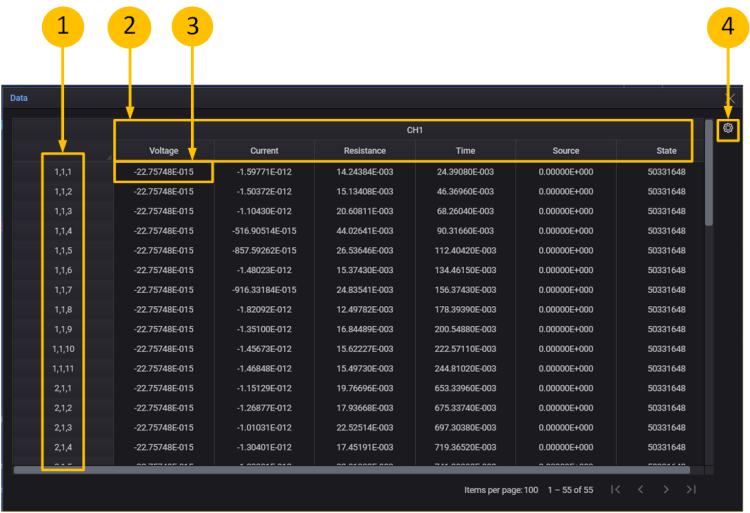
- Row Header -
Sweep measurement format: <Repeat Number>, <VAR2 Step Number>, <Var1 Step Number>
Sampling measurement format: <Repeat Number>, <Sampling Index> -
Column Header -
Format: <Channel Name> <Measured Parameter Name>.
<Channel Name> is defined in Channel Settings tab.
<Measured Parameter Name > is the measured data type ( e.g. Volt, Current ) - Data Cell - Format: <Scientific> or <Engineering>
For compliance status, the cell is displayed with a yellow background.
For reaching to compliance status, the cell is displayed with an orange background.
For measurement range overflow status, the cell is displayed with a pink background.. - Click the gear
 button access the Table settings.
Table Settings
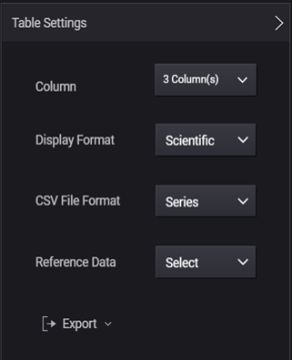
| Column
|
Adds/deletes the displayed column data.
Check the box to show; Uncheck the box to hide. By default, only the measured voltage and/or current data and time data is displayed. You can select the column data to display on the Select Column dialog. The Source column is only valid during sweep measurements. The Formula tree shows math expression definitions. The leading "(REF)" in a name means reference data. 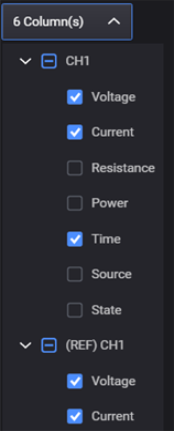 |
| Formula | Shows/hides the formula data. This selection only appears when there are saved formulas. |
| Display Format |
Selects the number format for the displayed data:
|
| CSV File Format |
Selects the exported CSV data format:
|
| Reference Data | Save: Saves the measured data as reference data. It is kept in volatile memory. Clear: Clears the reference data saved in volatile memory. |
| Export |
Export Data as CSV: Exports the table data to a CSV (Comma Separated Value) file. |