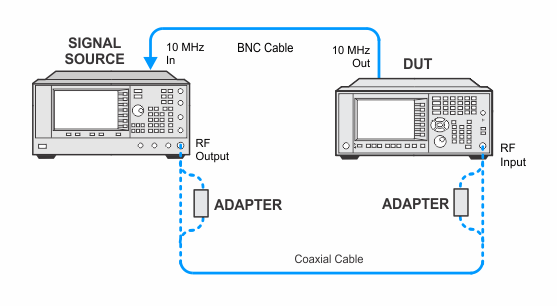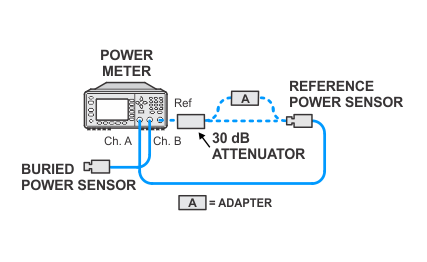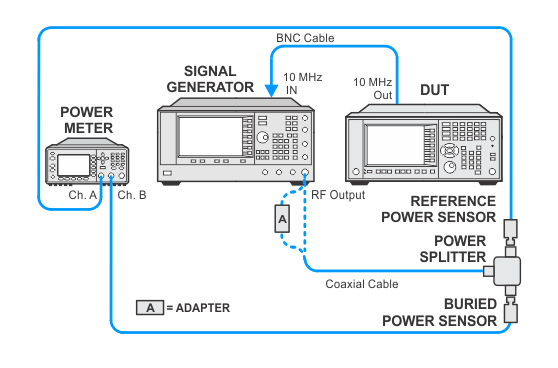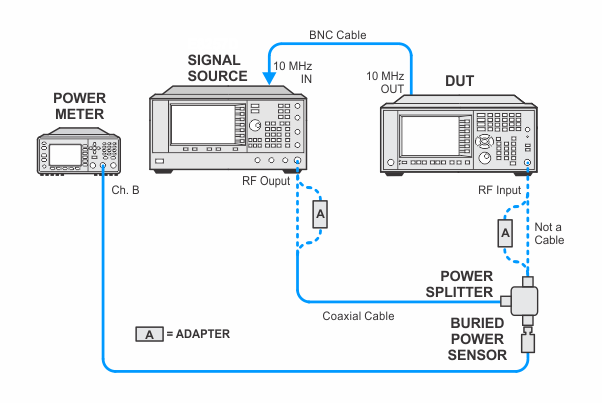
In the following setups, cables are designated as solid lines and direct connections are designated as dashed lines.
UXA — N9040B with frequency options ≤ 526
The Adaptive Flatness routine plots out the uncorrected frequency response on the analyzer trace. This is done by placing the analyzer trace in max hold then sweeping a source through the frequency band in 600 MHz "chunks". The data needs to be taken in 600 MHz chunks because the IF Image is present at +/– 322.5 MHz from the center frequency. The chunks are then stitched together to generate a trace for the entire frequency band. The trace can be seen as plot of conversion loss versus frequency. The trace data is then extracted from the analyzer and processed.
Click here for troubleshooting.
|
Test Equipment |
Recommended Model Number |
|---|---|
|
Microwave Signal Generator #1 |
PSG Models |
|
Power Meter |
N1914B |
|
Microwave Power Sensor, low power
|
8485D |
|
Microwave Power Splitter
|
11667B |
|
Millimeter Power Sensor, low power
|
8487D |
|
Millimeter Power Splitter
|
11667C |
|
30 dB Fixed Attenuator |
11708A |
|
Coaxial Cable, 2.4 mm |
8120-6164 |
|
Coaxial Cable, 3.5 mm |
11500E |
|
BNC Cable |
8120-1840 |
|
Type-N (m) to 3.5 mm (m) adapter |
1250-1743 |
|
3.5 mm (f) to 3.5 mm (f) adapter |
83059B |
|
3.5 mm (f) to 2.4 mm (f) adapter |
11901B |
|
3.5 mm (f) to Type-N (m)
|
08485-60005 |
|
2.4 mm (f) to Type-N (m)
|
08487-60001 |
|
|
In the following setups, cables are designated as solid lines and direct connections are designated as dashed lines. |


