Error Vector Spectrum (802.16 OFDM)
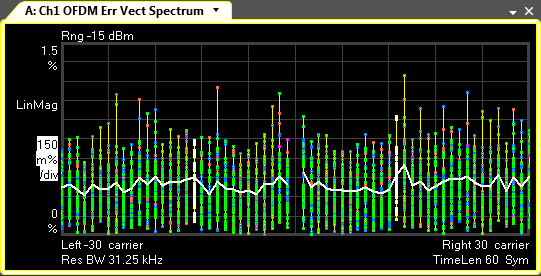
Error Vector Spectrum shows the signal RCE (EVM) vs. time and frequency. The Error Vector Spectrum provides both the RMS average Error Vector Magnitude (white line) and the individual Error Vector Magnitudes (EVM Error vector magnitude (EVM): A quality metric in digital communication systems. See the EVM metric in the Error Summary Table topic in each demodulator for more information on how EVM is calculated for that modulation format.) for each subcarrier for all symbols within the burst. The individual symbol EVMs are displayed by common subcarrier number. That is, for a particular subcarrier, the EVMs for all symbols within the burst are shown. This provides a convenient way to view all the EVMs at a particular subcarrier for all symbol-times in the burst. The trace data includes data results for both the pilot and data subcarriers but subcarrier 0 is not used.
Symbol EVM is the error vector magnitude between the measured (IQ Meas) symbol vector and an ideal (IQ Ref) symbol vector. RMS Error Vector Spectrum trace data is the average error vector magnitude of all the symbol EVMs at a particular subcarrier for all symbol-times within the burst.
You can decrease (or limit) the number of symbol-times included and displayed in the data results with the Max Result Length format parameter. The TimeLen display parameter (located in the lower left of the grid) shows the number of symbol-times included in the data results.
Interpreting the trace data
The y-axis annotates the EVM magnitude and the x-axis annotates the OFDM Orthogonal Frequency Division Multiplexing: OFDM employs multiple overlapping radio frequency carriers, each operating at a carefully chosen frequency that is Orthogonal to the others, to produce a transmission scheme that supports higher bit rates due to parallel channel operation. OFDM is an alternative tranmission scheme to DSSS and FHSS. subcarrier number, which ranges from -100 through +100 (200 subcarriers in all (unless limited), subcarrier 0 is not used). The z-axis annotates the symbol position. The trace data format shows all the symbols at a particular subcarrier for all the symbol-times within the burst. Placing a marker on a subcarrier provides the subcarrier number, the symbol number, the subcarrier EVM (for that particular symbol) and the RMS average EVM (for that particular subcarrier).
This Error Vector Spectrum trace data uses a multi-color trace that assigns a unique color to the pilot subcarriers, the data subcarriers, and the RMS (average) EVM trace. There are also separate colors assigned for the different data modulation types: BPSK Binary phase shift keying - A type of phase modulation using 2 distinct carrier phases to signal ones and zeros., QPSK Quadrature phase shift keying, 16QAM, and 64QAM.
The colors are also user definable (see Display Preferences).
This Error Vector Spectrum trace data shows a demodulated OFDM IEEE Institute of Electrical and Electronics Engineers. A US-based membership organisation that includes engineers, scientists, and students in electronics and related fields. The IEEE developed the 802 series wired and wireless LAN standards. Visit the IEEE at http://www.ieee.org 802.16a/d signal with 60 carriers from -30 to 30.
Trace A Marker trace data:
-
Subcarrier number: -20 (subcarrier 0 is not used)
-
Symbol number: 24
-
Symbol EVM: 165.8 m% (for symbol 24 at subcarrier -20)
-
RMS Average EVM (not shown): 451.9 m% Avg (all symbols at subcarrier -20)
The TimeLen trace parameter is the total number of symbol-times shown and included in the measurement. For IEEE 802.16 a/d signals, this includes both the FCH and DATA Symbol-times. The first symbol-time in the measurement is data for the FCH symbol-time.
See Also