Best-Fit FM Metrics (Advanced-Radar/Hopping)
Menu Path:
Menu Path:
Menu Path:
This topic describes the Linear FM Frequency Modulation metrics displayed in the Result Tables, Histograms, and Trend Lines. The Best-Fit Freq metrics are measured over each pulse's user-specified sample analysis time interval, which is determined by the user-specified FM (CW/FM) or Trianglular FM (TFM) analysis offset From Pulse Top Start and offset From Pulse Top End properties.

Best-Fit metrics are only available for Linear FM and Triangular FM pulse measurements. The Best-Fit metrics for Triangular FM are identical in description to those for Linear FM. Triangular FM has two identical sets of Best-Fit metrics: one for the first chirp, and a "2nd" for the second chirp.
-
Best-Fit Freq Mean (Hz)
-
Best-Fit Freq Mean frequency in Hz, reports the mean frequency of a best-fit linear least squares regression line.
-
Best-Fit Freq Mean (Hz) = (Best-fit Freq Start (Hz) + Best-fit Freq Stop (Hz))/2
-
-
Best-Fit Freq Start (Hz)
-
Best-Fit Freq Start frequency in Hz, reports the start frequency of a best-fit linear least squares regression line.
-
-
Best-Fit Freq Stop (Hz)
-
Best-Fit Freq Stop frequency in Hz, reports the stop frequency of a best-fit linear least squares regression line.
-
-
Best-Fit Freq Start 2nd (Hz) (Triangular FM only)
-
Best-Fit Freq Start frequency 2nd in Hz, reports the start frequency of a best-fit linear least squares regression line for the Triangular FM 2nd chirp.
-
-
Best-Fit Freq Stop 2nd (Hz) (Triangular FM only)
-
Best-Fit Freq Stop frequency 2nd in Hz, reports the stop frequency of a best-fit linear least squares regression line for the Triangular FM 2nd chirp.
-
-
Best-Fit Freq Pk-Pk Dev (Hz)
-
Best-Fit Freq Peak-to-Peak Deviation in Hz, reports the absolute frequency deviation of a best-fit linear least squares regression line.
-
Best-Fit Freq Pk-Pk Dev (Hz) = abs(Best-Fit Freq Stop (Hz) - Best-Fit Freq Start (Hz))
-
-
-
Best-Fit Freq Slope in Hz/us, reports the frequency slope rate of a best-fit linear least squares regression line.
-
-
Best-Fit Freq Slope 2nd (Hz/µs) (Triangular FM only)
-
Best-Fit Freq Slope in Hz/us, reports the frequency slope rate of a best-fit linear least squares regression line for the Triangular FM 2nd chirp.
-
-
Best-Fit Freq INL (%)
-
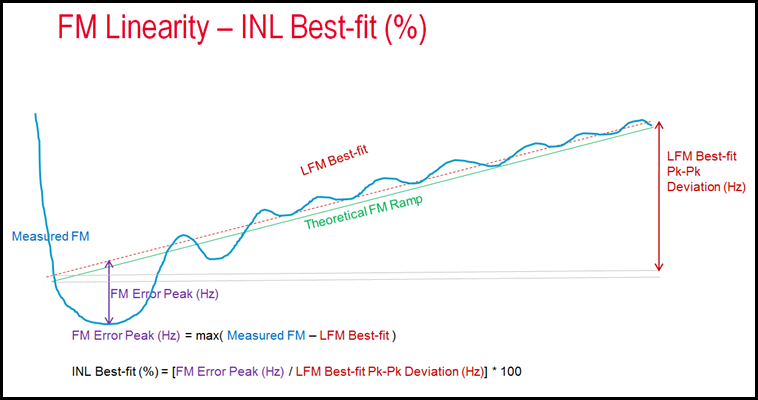
The Best-Fit Freq Integral Non-Linearity in % metric is the ratio of worst case peak frequency modulation error over peak-to-peak frequency deviation of a best-fit linear regression line applied to the measured FM sample data (See illustration below).
-
Best-Fit FM INL (%) = (Freq Error Peak (Hz) / Best-Fit Freq Pk-Pk Dev (Hz)) * 100.0
-
-
Best-Fit Freq INL 2nd (%) (Triangular FM only)
-
The Best-Fit Freq Integral Non-Linearity in % metric is the ratio of worst case peak frequency modulation error over peak-to-peak frequency deviation of a best-fit linear regression line for the Triangular FM 2nd chirp, applied to the measured FM sample data (See illustration below).
-
Best-Fit Freq INL 2nd (%) = (Freq Error Peak (Hz) / Best-Fit Freq Pk-Pk Dev (Hz)) * 100.0
-
-
Best-Fit Freq Apex Freq (Hz) (Triangular FM only)
- The Best-Fit Freq Apex Frequency metric describes the Frequency location of the Triangular FM peak, derived from crossover point of the two individual LFM chirp’s Best-Fit reference lines.
-
Best-Fit Freq Apex Time (Sec) (Triangular FM only)
- The Best-Fit Freq Apex Time metric describes the Time location (reported relative to Pulse Top center time), of the Triangular FM peak, derived from crossover point of the two individual LFM chirp’s Best-Fit reference lines.

