FSK Meas and FSK Ref, Spec and Time (Digital Demod)
(Available only when the digital-demodulation format is or )
When or is the demodulation format, the VSA's digital demodulator produces two signals:
The FSK Measured signal is the measured signal that has been FM Frequency Modulation demodulated, filtered, carrier locked, and symbol locked.
The FSK Reference signal is the signal that would result after demodulating the signal if the signal were ideal (contained no errors). It is the ideal signal against which the FSK Measured signal is compared. The VSA creates this signal from the detected bits (symbols).
Online help for FSK includes a block diagram that shows how FSK measured and FSK reference are generated.
Filtering
Select different filters for the FSK Measured and FSK Reference signals. Use Measured Filter to select filtering for the FSK Measured signal; use Reference Filter to select filtering for the FSK Rreference signal.
Time-Domain Displays
The FSK digital demodulator produces REAL time-domain data. If is selected, the VSA displays the FSK Measured signal in the time domain. Likewise, if is selected, the VSA displays the FSK Reference signal in the time domain.
If normalization is OFF, the VSA displays the actual frequency deviation in units of Hz. If normalization is ON, the VSA normalizes the FSK Measured and Reference traces to the deviation, and shows the deviation for each point as a percentage. For example, if normalization is ON, each point in the FSK Measured trace is derived as follows:

The following parameters affect how the VSA displays the FSK Measured and FSK Reference signals:
- Result Length determines the number of symbols, which determines the length of the displayed trace.
- Points / Symbol determines the number of points between symbols. Increase to increase the resolution; decrease it to decrease the resolution.
The FSK demodulator produces real data; not complex data. Therefore, IQ diagrams display a horizontal line because the imaginary part is zero. Likewise, selecting a trace format of Imag (Q) or Q-Eye also displays a horizontal line (zero).
Frequency-Domain Displays
If is selected, the VSA displays the spectrum of the FSK Measured signal. Likewise, if is selected, the VSA displays the spectrum of the FSK Reference signal. The VSA produces the spectrum by windowing and performing an FFT on the FSK Measured or FSK Reference signal.
If a measured filter is selected, the spectrum represents the signal AFTER filtering.
By default, the VSA displays the log(dB) magnitude when or is selected.
The span for the displayed spectrum is a function of two parameters: the symbol rate and Points / Symbol, as follows:

Span-Demod is the span displayed when or is selected.
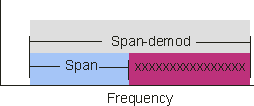
It is possible to set the symbol rate and the such that Span-Demod exceeds the information bandwidth (frequency span) of the VSA. The following illustration shows the case where Span-Demod exceeds the frequency span.

The illustration shows an "x" in the region where Span-Demod exceeds the frequency . Because the frequency-domain data outside of the frequency span in these traces is an artifact of demodulation processes and does not contain any useful information about the actual signal, the VSA will not show information that exists in this region.
Frequency-Domain Displays and Aliasing
It is important to know that the VSA uses one sample rate to take data, and another (Sample_rate_demod) to display the demodulated data, as follows:

As shown, Frequency Span determines the sample rate used to take data, whereas the symbol rate and determine the sample rate used to display demodulated data.
If the sample rate of the demodulator is less than that used to take data, the VSA displays DATA? to inform that the FSK Measured and FSK Reference spectrums may contain alias by-products.
In summary, to avoid aliasing in the spectrum display, always set the frequency , symbol rate, and such that the sample rate of the demodulator equals or exceeds that used to acquire data.
