IQ Meas Spec and IQ Ref Spec (Digital Demod)
When is enabled, the and trace data is the frequency spectrum of the IQ Meas Time and IQ Ref Time trace data respectively. The VSA produces the spectrum by windowing and FFTing the I/Q measured or I/Q reference data.
The VSA's digital demodulator removes carrier frequency error. Therefore, in the error vector spectrum display, the carrier frequency error must be added to marker readouts to obtain input signals frequency information. The carrier frequency error () is shown in the symbol table.
If a measured filter is selected, the spectrum represents the signal AFTER filtering.
By default, the VSA displays the data in log(dB) magnitude format. This can be changed in the dialog box ( dropdown box).
The frequency span for the displayed spectrum is a function of two parameters: the symbol rate and Points / Symbol, as follows:
|
|
|
where: Span-Demod is the span displayed when IQ measured spectrum or IQ reference spectrum is selected. |

It is possible to set the symbol rate and the such that Span-Demod exceeds the information bandwidth of the VSA. The information bandwidth of the VSA is set with frequency span.
The following illustration shows the case where Span-Demod exceeds VSA measurement span.
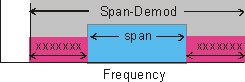
The illustration shows an "x" in the region where Span-Demod
exceeds the measurement span. Because the VSA essentially
filters out all information outside of span, the VSA will not show
information that may exist in this region.
Aliasing
It is important to know that the VSA uses one sample rate to acquire data and another sample rate (Sample_rate_demod) to display the demodulated data, as follows:
Sample Rate = 1.28 x [span]
Sample_rate_demod = (symbol rate) x (Points / Symbol)
As shown, the frequency span determines the sample rate used to acquire data, whereas the symbol rate and determine the sample rate used to display demodulated data.
If the sample rate of the demodulator is less than that used to acquire data, the VSA displays DATA? to show that the I/Q measured and I/Q reference spectrums may contain alias by-products.
In summary, to avoid aliasing in the spectrum display, always set the frequency , symbol rate, and such that the sample rate of the demodulator equals or exceeds that used to acquire data.
See Also