Making an OBW/BW Measurement
The OBW Occupied bandwidth is closely related to channel power. It indicates how much frequency spectrum is covered by some given percentage (often 99%) of the total power of the modulated signal. marker provides an easy method for performing occupied bandwidth (OBW) and X dB bandwidth (BW) measurements. The OBW/BW measurement results are shown in the Markers Window and more detailed information is available in the OBW Summary Table.
Begin the OBW or BW measurement by selecting trace(s) to display spectrum information. In the following example, we will set Trace A and Trace C to contain the same Spectrum data and assign different OBW marker regions to them.
The OBW marker only applies to trace data with spectrum data results; other trace data is not allowed. The check box in the is disabled for non-spectrum trace data results.
OBW/BW measurement is allowed for Math functions as long as the X-axis data units are "Hz".
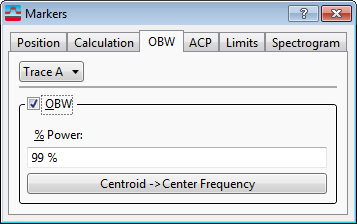
Select the A: Ch1 Spectrum trace to make it the active display, then select and click the checkbox to enable the OBW marker function and start the occupied bandwidth and X dB bandwidth measurements on Trace A.
The Region Shown parameter lets you choose to display either occupied bandwidth or X dB bandwidth on the selected trace. The default selection is Occupied Bandwidth. For Trace A, leave the default selection. Occupied bandwidth is based on the setting (default = 99%). Use this setting to make adjustments.
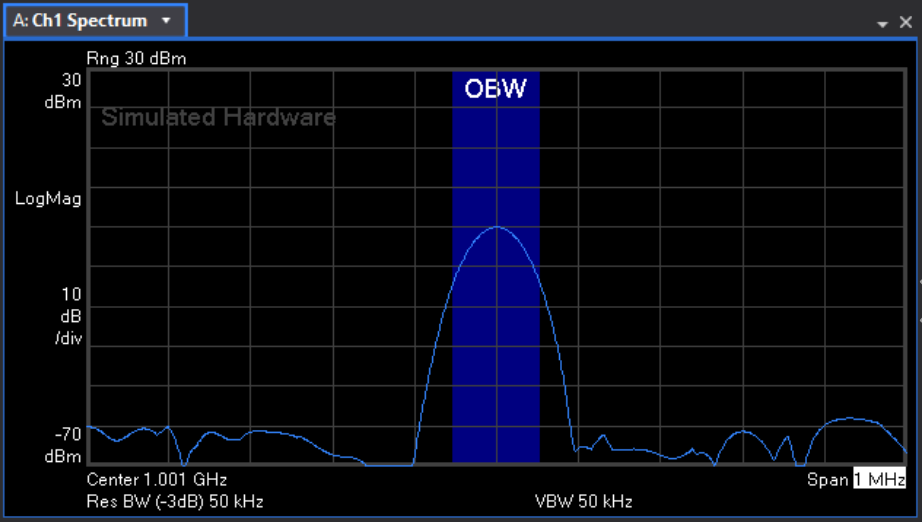
Trace A will show the occupied bandwidth (OBW), similar to below:
Select the C: Ch1 Spectrum trace to make it the active display, then select and click the checkbox to enable the OBW marker function and start the occupied bandwidth and X dB bandwidth measurements on Trace C.
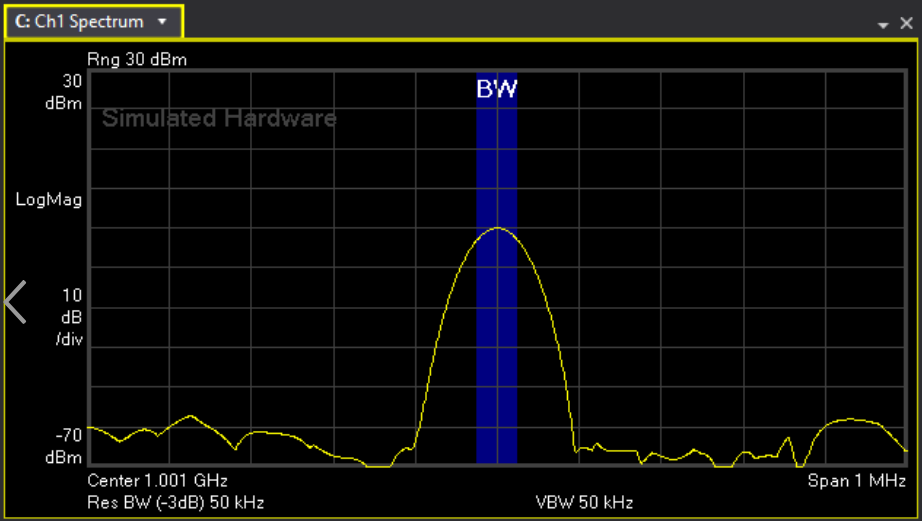
Change the Region Shown selection to X dB Bandwidth for Trace C. X dB bandwidth is based on the setting (default = -3.01 dB). Adjust the threshold value for your signal.
Trace C will show the X dB bandwidth (BW), similar to below:
OBW Summary Table and Markers Window Data
OBW/BW data results can be found in two places: the OBD Summary Data trace and the Markers data readout window.
-
OBW Summary Data trace:
-
Make Trace B the active trace by clicking anywhere on Trace B.
-
Show the OBW Summary table in trace B:
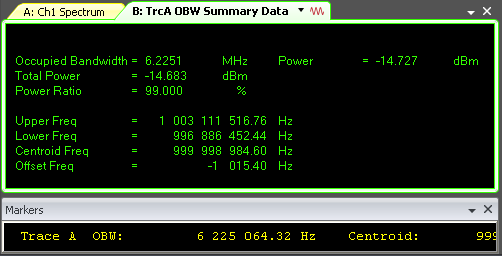
Click . The OBW Summary table displays both Occupied Bandwidth and X dB Bandwidth measurement results regardless of the Region Shown by the marker in the Spectrum trace.
-
-
-
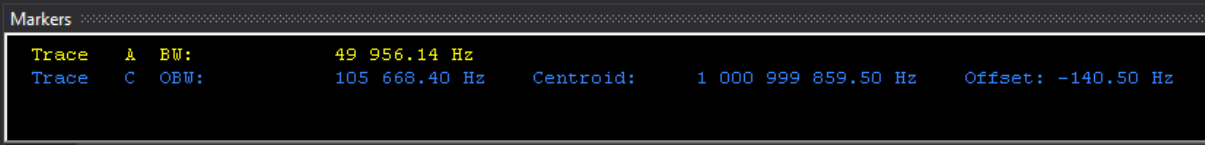
Click to add the Markers data readout panel at the bottom of the VSA application window. The OBW marker for each trace will show either OBW Results or BW Results in the Markers Window depending on whether the marker's Region Shown parameter is set to Occupied Bandwidth or X dB Bandwidth.
-
See Also
OBW Summary table trace data (Markers)