OBW Summary Table (Markers)
The OBW Occupied bandwidth is closely related to channel power. It indicates how much frequency spectrum is covered by some given percentage (often 99%) of the total power of the modulated signal. marker function provides an table which contains results that are derived from the OBW marker on the corresponding trace. There is an table available for each OBW Marker.
The table will only contain data when the OBW marker is enabled for the corresponding trace and that trace contains spectrum data.
To show the OBW Summary Table
To show the table, select the table that corresponds to a trace with the OBW marker enabled. For example, if the OBW marker of interest was shown in Trace D, activate any of the other trace windows and click .
To learn how to use the OBW Marker, see Making an OBW/BW Measurement.
Averaging
The table always shows OBW results calculated from the data shown in the spectrum trace containing the OBW marker.
Averaged OBW results can be obtained by enabling averaging and placing the OBW marker on an averaged trace. When this is done, the table will show values calculated from the averaged trace.
Data Results
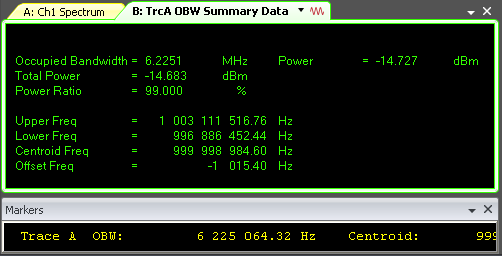
The table provides both OBW and BW data results (to learn about how OBW data results are computed, see the Measurement Algorithm section of the About OBW Marker topic):
Occupied Bandwidth
-
[Hz]: bandwidth containing the specified
-
[dBm deciBels referenced to a milliWatt: dB relative to 1 milliwatt dissipated in the nominal input impedance of the analyzer]: measured power in the occupied bandwidth
-
[dBm]: total power in the measurement span
-
[%]: ratio of the power in the occupied bandwidth to the , which is equal to the % Power parameter
-
[Hz]: the occupied bandwidth's upper frequency
-
[Hz]: the occupied bandwidth's lower frequency
-
[Hz]: the midpoint frequency of the OBW
-
[Hz]: the difference between the VSA's center frequency and the OBW centroid frequency
X dB Bandwidth
-
[Hz]: calculated X dB bandwidth
-
[dB]: threshold used in calculating the X dB bandwidth, which is specified by the X dB Bandwidth Threshold parameter
-
[Hz]: the X dB bandwidth's lower frequency
-
[Hz]: the X dB bandwidth's upper frequency
Querying summary table data results programmatically
To programmatically query the Trace Summary Table data results using the Summary() and SummaryUnit() methods in the MeasurementData object.
See the How To Query Summary Table Data Results topic for more information.
See Also
Making an OBW/BW Measurement (Markers)