Display Resolution: Spectral Displays (Vector)
For spectral displays with vector measurements, the output of the FFT Fast Fourier Transform: A mathematical operation performed on a time-domain signal to yield the individual spectral components that constitute the signal. See Spectrum. yields more points than there are frequency points shown in a spectrum trace.
Some FFT analyzers have a fixed number of frequency points (often called lines or bins) and use the same number of frequency points regardless of frequency span. However, with vector measurements in Keysight 89600 VSA software, you may select a variable number of frequency points. Vector measurements have a default resolution of 801 frequency points but you may select more points for better display resolution.
For each frequency span, the vector measurement assigns a discrete frequency value to each frequency point shown on a spectrum trace, such that the distance between points (frequency resolution) is as follows:
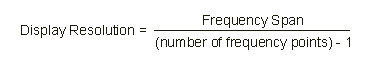
The vector measurement then uses the specified start frequency to determine the actual frequency values.
To better understand the concept of frequency display resolution, insert a marker into a Spectrum trace, and move the marker from point to point (use the left and right arrows on the keyboard). Notice how the marker jumps to each point¾you cannot put the marker between points. As you move the marker, also notice how the marker readout steps through a series of discrete frequencies that correspond to each frequency point.
See the Frequency Points topic for more information.
See Also
