Statistics (Pulse)
Menu Path:
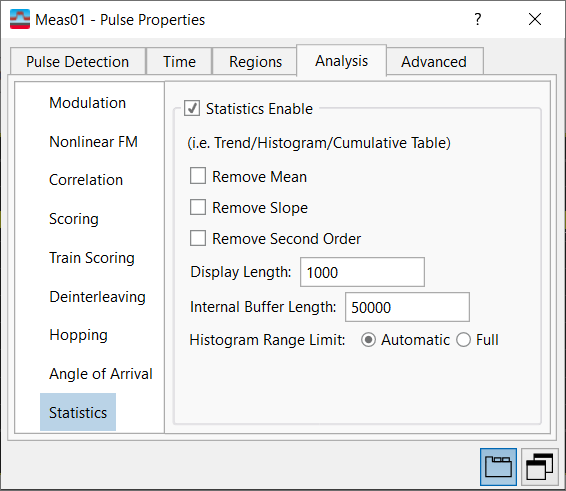
The Analysis tab's Statistics panel allows you to control all Trend, Histogram, and Cumulative Results Table data gathering and statistical/trace results.

The Statistics panel allows you to set the following parameters:
-
Statistics Enable -- Allows you to enable or disable all Trend, Histogram, and Cumulative Results Table data gathering and trace results. You can specify if Mean, Slope, or Second Order fit should be removed from the Trend/Histogram result traces.
-
Remove Mean, Remove Slope, Remove Second Order -- When enabled (checked) all Trend and Histogram trace results will be reported after first removing the accumulated Trend and Histogram statistical data set for the selected computation (mean value, first order linear slope best-fit, or second order curve best-fit).
-
Display Length -- Specifies the number of points displayed within Trend trace results, or pulses displayed within the Cumulative Pulse Table. For Trend trace results, if the available data exceeds Display Length points, then the most recent “Display Length” amount of points are displayed, resulting in a scrolling trend display. If available data is less than display length, the available data is shown at the left of the trace and the remaining point's values are set to the first data point’s value.
-
Internal Buffer Length -- Specifies the maximum number of points used for Trend/Histogram/Cumulative Results data gathering and analysis. If the available data exceeds the Internal Buffer Length points, then the most recent “Internal Buffer Length” points are retained and used for Trend/Histogram /Cumulative Results data gathering and analysis.
-
-
Automatic -- the min and max limits of the histogram are set to be approximately mean +/- 3 * standard deviation of the data. Automatic tries to center the histogram and show most of the data (if the data is Gaussian, most of the data should lie between the min and max limits).
-
Full -- the actual min and max limits of the data are used for the histogram.
-
-
See Also
