Ripple Metrics (Pulse)
Menu Path:
Menu Path:
Menu Path:
This topic describes the Ripple metrics displayed in the Result Tables, Histograms, and Trend Lines.
-
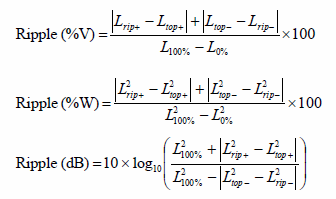
Ripple (dB) --Reports the amplitude level ripple, per pulse, as dB. This metric is measured over the specified Ripple Analysis Width (%).
-
Ripple (%) -- The maximum difference between the waveform and the On Line while in the on position, divided by Range.
-
When Thresholds Amplitude Domain is set to Voltage, the Ripple (%) metric is reported in %V units.
-
When Thresholds Amplitude Domain is set to Power, the Ripple (%) metric is reported in %W units.
-
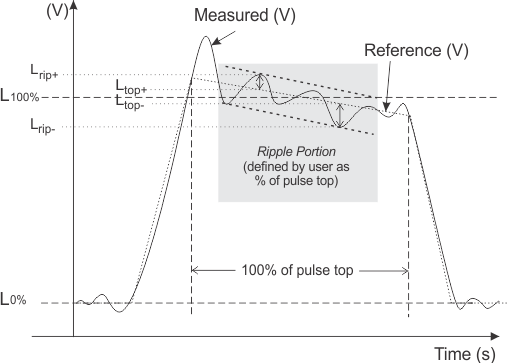
Ripple is calculated as the measured difference between the maximum and minimum amplitude deviation points from the ideal droop compensated pulse top amplitude reference line.
The Ripple measurement interval can be specified by the user using the Ripple Analysis Width (%) property as a centered percentage time interval within the detected pulse top sample region, as illustrated in the pulse waveform diagram below.
Measured Ripple metrics may be reported as follows, in either percentage or dB format.
- When Thresholds Amplitude Domain is set to Voltage, the Ripple (%) metric is reported in %V units.
- When Thresholds Amplitude Domain is set to Power, the Ripple (%) metric is reported in %W units.
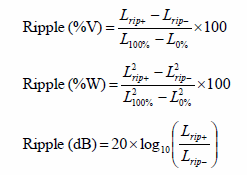
For a pulse signal containing no measured droop, the values L_top+ = L_top- = L_100%, and the above formula’s reduce to:
The following image shows the levels used in the above calculations.