Metric Computations
This topic explains how the VSA software computes metrics in the Statistics Tables.
Only complete detected pulses are reported within Pulse Table metric results, and marked as valid in detected pulse highlighting.
Therefore, for segmented captures, partial pulses present at the start of a time acquisition segment (such as only the falling edge of a pulse) and partial pulses present at end of a time acquisition segment (such as only the rising edge of a pulse) are ignored and not included in Pulse Table results. For further details, see Segmented Data Acquisition.
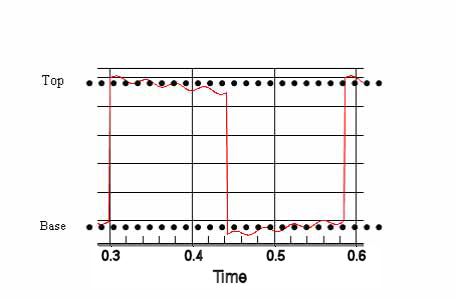
Top and Base Levels
The first analysis operation is the calculation of Top and Base levels, using the bi-modal histogram method. Amplitude samples for the entire Time Record are collected into a histogram organized as frequency-of-occurrence versus magnitude. For pulses, the histogram should be bi-modal, with one “hump” representing the “On” state and the other “hump” representing “Off” state. (You can view these “humps” by enabling and viewing the PDF 1) Probability Density Function Trace Data, or 2) Portable Document Format (PDF) created by Adobe Systems is an open standard for document exchange. Graph.) The peaks of each hump – that is, the single most frequent amplitude level for each – becomes the “Top” and “Base” respectively. A waveform where these two levels are not well separated, or where the majority of samples are scattered in a wide variety of amplitude values, will fail to yield well-defined “top” and “base” levels.
User-Adjustable Analysis Thresholds
The “shape” of each pulse is parametrized relative to amplitude threshold levels, as described below. These thresholds are scaled to Top and Base, as described above; the benefit is that the threshold levels adjust automatically to variations in the pulse-on amplitude and noise floor.
The Pulse Analysis tab contains controls that let you view or modify the thresholds.
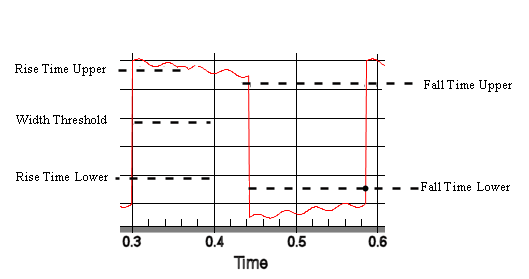
The word “Range” below means the difference between Top and Base, a positive number. These values are in Volts; 50% of Top would correspond to 3 dB down.
Rise Time Lower – threshold for transition between Base and the rising edge of the pulse. The default value is 10% of Range plus Base. Rise Time Upper – threshold for transition between rising edge and Top. The default value is 90% of Range plus Base.
Fall Time Upper – threshold for transition between rising edge and Top. The default value is 90% of Range plus Base.
Fall Time Lower – threshold for transition between falling edge and Top. The default value is 10% of Range plus Base.
Width Threshold – threshold for pulse mid amplitude. The default value is 50% of Range plus Base. This is a single threshold for both rising and falling edges.
For each pulse, the Pulse Measurement software computes the amplitude value and time value which best represents the six points where the data trace crosses these thresholds. These points are interpolated (straight line) between actual measured data samples, and do not need to coincide with them. These points can be referred to as Rising-Lower, Rising-Width, Rising-Upper, etc.
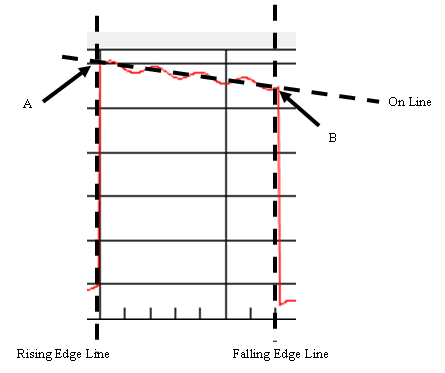
Pulse “Corner” (A and B) Points
Two more points are found, which represent the “corners” of a trapezoid that approximates each pulse in the trace. Three lines are fit to the pulse data in order to perform the analysis (see figure below). First, a line is fit between the Rise Time Lower and Rise Time Upper points. Next, a line is fit between the Fall Time Upper and Fall Time Lower points. (Remember, these points are interpolated between measured samples.) Finally, a line (On Line) is fit to the pulse points occurring between the Rise Time Upper and Fall Time Upper thresholds using a least squares approach. Points A and B are the intersections between the three lines (see Figure below). The amplitude values and time values for points A and B are calculated, and do not coincide with measured samples.