Time (TD-SCDMA)
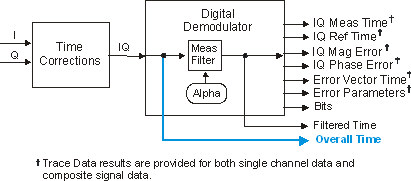
When TD-SCDMA demodulation is enabled, the trace shows the pre-demodulation time record data. The Result Length parameter determines the amount of time data that is analyzed and displayed.
Overall Time data is unaffected by time averaging.
VSA signal flow (see Digital Demodulation Block Diagram):

Display Format
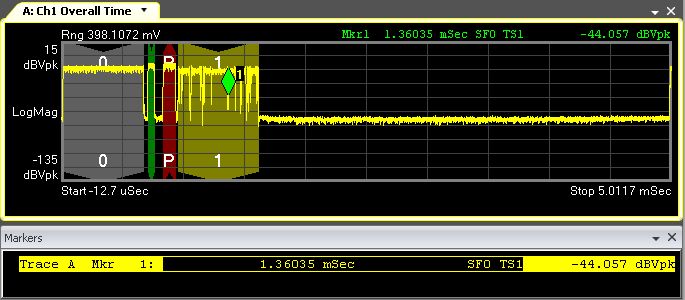
The data is shown in a multi-color alphanumeric format that identifies the detected active timeslots within each measured sub-frame including the uplink and downlink pilot timeslots. The active Marker timeslot used for data analysis is also highlighted. The colors can be changed and redefined using the Display Preferences Color tab.
Interpreting the Overall Time trace data results

|
Active Data Timeslots: |
The numbers 0 and 1 show that Timeslot 0 and Timeslot 1 are active timeslots within the measured sub-frame. Timeslot 0 is highlighted to show that it's an active timeslot but not selected for data analysis. Timeslot 1 is highlighted to show that it was selected by the Marker and used for the data analysis and trace data results. |
|
Downlink pilot timeslot: |
The letter "P" and green color show that the DwPTS pilot timeslot is an active timeslot. |
|
Uplink pilot timeslot: |
The letter "P" and red color show that the UpPTS pilot timeslot is an active timeslot. |
|
All timeslots: |
The arrow direction of the background bar shows the uplink/downlink status for each timeslot. This is fixed for pilots and timeslot 0 and set for other traffic timeslots by Uplink Switch Point. |
|
Marker Readout |
Marker Location: 1.36035mSec after the start of the sub-frame. Power Level: -23.462 dBVpk |
|
|
Notes: Colors are shown with default settings. To change colors, use the tab. |
and parameter entry shortcut: Right click on the desired Timeslot and select .
See Also
