Spectrum (TEDS)
shows the frequency spectrum of your recorded or measured input signal, averaged when averaging is enabled. Display information includes the Center frequency, the ResBW (Resolution Bandwidth), frequency Span, and the equivalent TimeLen (time length). To change the format of the trace, select and navigate to the parameter you wish to modify. To enable averaging for this trace, click .
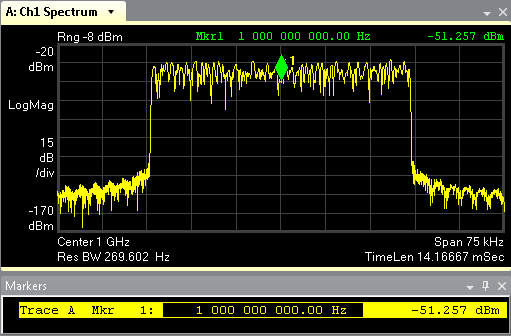
For best viewing select to scale the trace. If the trace shows NO DATA, check your recorded signal or hardware input and TEDS demod properties.
Make sure you select to place a marker on the trace and then review the spectrum information in the marker readout window, in particular, the frequency and power (dBm deciBels referenced to a milliWatt: dB relative to 1 milliwatt dissipated in the nominal input impedance of the analyzer), for each marker location. Once you have a marker on the trace, use your left and right arrow keys to move the marker through the spectrum display in small increments or hold down the CTRL key at the same time to move in larger increments. Use the up and down arrow keys to sequence from peak to peak.
For an instantaneous spectrum trace (most recent measurement), instead of an averaged spectrum trace, see Inst Spectrum . Or you can disable averaging on this trace using .
See Also