Preamble Error (802.11a/g/j/p OFDM)
shows the correlation between segments of the measured preamble signal with the ideal preamble signal. The measurement can be specified for either the or the (Long Training sequence) segments of the preamble using the Synchronization Reference parameter ().
A perfectly stable signal would show a constant phase and magnitude for each point in the trace.
Measurement Concepts
calculates the correlation between the measured preamble symbol (Short Sync or Channel Estimation training sequence) and a computed ideal waveform. The result is a complex number that describes the preamble error (deviation from ideal) in both magnitude and phase.
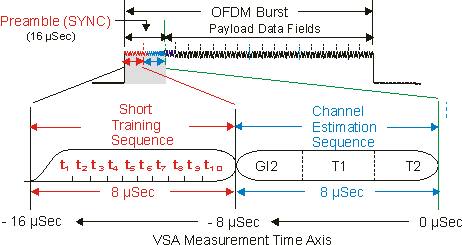
To represent this error as a function of time, the preamble symbol is divided into ten equal segments, each 0.8 microseconds in length. The average error is calculated individually for each segment, and the ten data points plotted as the displayed measurement trace.
The y-axis of the measurement display defaults to either magnitude or phase. The x-axis is calibrated in absolute time, relative to the beginning of the first data symbol. The x-axis value for each of the plotted data points denotes the ending time for the 0.8 microsecond segment over which the error was computed.
Notice that the trace measurement start and stop times for the is between -16 uSec and -8 uSec and for its between -8 uSec to 0 uSec.
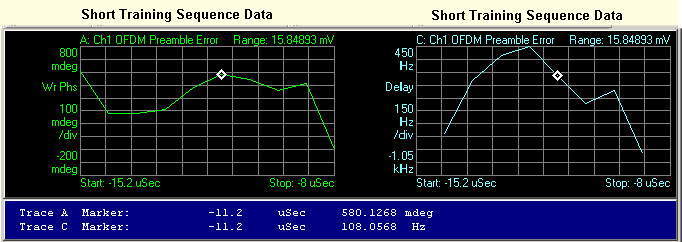
Trace A shows the in terms of phase versus time, but the data results can be shown in terms of frequency versus time (see Trace C). To show the information in terms of frequency, change the trace format to ()
trace data for the
in terms of Phase versus Time
Preamble Location: 11.2 uSec before the start of the Payload Data Fields (-11.2 uSec)
Preamble error: 580.1268 mdeg
trace data for the
in terms of Frequency versus Time
Preamble Location: 11.2 uSec before the start of the Payload Data Fields (-11.2 uSec)
Preamble error: 108.00568 Hz
When measuring the settling of a WLAN WLAN - Wireless Local Area Network: A system that includes the distribution system (DS), access points (APs), and portal entities. It is also the logical location of distribution and integration service functions of an extended service set (ESS). A WLAN system contains one or more APs and zero or more portals in addition to the DS. signal, it may be useful to view the phase transient in units of frequency. This involves calculating the slope of the phase error with respect to the x-axis units (time). To perform this conversion automatically, simply change the Trace Data setting from Phase to Delay, which will cause the results to be shown in Hertz. The VSA’s calculation, shown below, yields the average frequency during the two 0.8 microsecond segments centered on the displayed measurement point:
Freq(n) = [Phase(n+1) – Phase(n-1)] / 0.16 uSec
where n = displayed measurement points, from 2 to 9.
The Preamble Freq Error trace data provides better resolution than provides.
Before the VSA calculates preamble phase/frequency error, it calculates and removes any static frequency error (Transmit Center Frequency error). This error component is displayed as a single value on the Symbols/Errors table and represents the average frequency offset, relative to the VSA’s center frequency, calculated across a specific period of time. As shown in the following table, this measurement period always includes the entire preamble, but may or may not include the data payload symbols that follow, depending on the Phase Tracking ON/OFF setting in the OFDM Orthogonal Frequency Division Multiplexing: OFDM employs multiple overlapping radio frequency carriers, each operating at a carefully chosen frequency that is Orthogonal to the others, to produce a transmission scheme that supports higher bit rates due to parallel channel operation. OFDM is an alternative tranmission scheme to DSSS and FHSS. demodulator.
|
|
Short Sync. Sequence |
Channel Est. Sequence |
|
|---|---|---|---|
|
Phase Tracking = ON |
· |
· |
· |
|
Phase Tracking = OFF |
· |
· |
|
Thus, to convert the relative frequency deviation shown on the plot to an absolute frequency error, it is only necessary to add the Frequency Error value shown on the Symbols/Errors table.
In the current implementation of this measurement, there is a residual uncertainty of approximately 5 to 10 degrees for preamble phase errors measured during the This is due to the longer periodicity of this sequence, which makes the measurement quite sensitive to even small timing misalignments. For this reason, this measurement mode is recommended only in cases where relatively large amounts of preamble error are expected.
Residual phase and frequency settling that occurs after the preamble is measured via the Common Pilot Error display. With turned ON, this display shows the average phase error of the four OFDM pilots as a function of time (versus data symbol number). To convert to frequency units, select Trace Format = .
See Also
Common Pilot Error (802.11a/g/j/p OFDM)