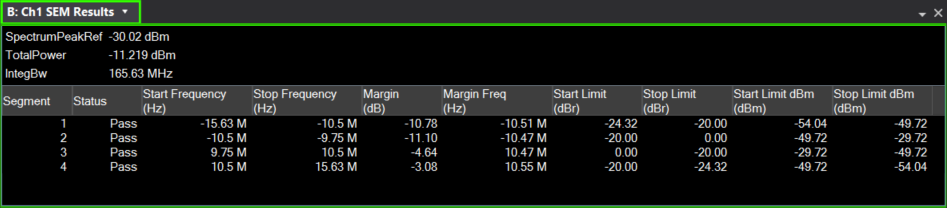
SEM Results (802.11a/g/j/p OFDM)
The trace shows a results table with per-segment pass/fail status and margin information for the limit line.
The top three results indicate the following:
-
SpectrumPeakRef - Peak used for the relative dBr limit line
-
TotalPower - Total power in dBm deciBels referenced to a milliWatt: dB relative to 1 milliwatt dissipated in the nominal input impedance of the analyzer
-
IntegBw - Integration bandwidth (over which the total power is calculated, which is also the VSA span)
Each row of the results table corresponds to one segment of the spectral mask. The mask corresponds to the SEM Combined limit line on the Spectral Emission Mask trace.
-
Segment - Mask segment index (1, 2, 3, ...)
-
Status - Pass or Fail (see Pass/Fail Logic)
-
Start Frequency (Hz) - Start frequency of the mask segment
-
Stop Frequency (Hz) - Stop frequency of the mask segment
-
Margin (dB) - Worst-case margin within the segment. Negative = passing (below limit), positive = failing (above limit).
-
Margin Freq (Hz) - Frequency where the worst margin occurs
-
Start Limit (dBr) - SEM Combined limit, relative to trace peak limit, at Start Frequency
-
Stop Limit (dBr) - SEM Combined limit, relative to trace peak limit, at Stop Frequency
-
Start Limit (dBm) - SEM Combined limit, in dBm, at Start Frequency
-
Stop Limit (dBm) - SEM Combined limit, in dBm, at Stop Frequency
Pass/Fail Logic
A segment passes if the measured PSD Power Spectral Density: See power spectral density. stays below the Combined limit at every frequency point within that segment. The margin is the worst-case difference (measured power minus combined limit), so negative values indicate passing and positive values indicate failing. See Spectral Emission Mask for more information on limit lines.
See Also