| The FieldFox assumes you have manually set up the CF, span, and amplitude settings. Refer to Chapter 9, “SA (Spectrum Analyzer) Mode (Option 233–Mixed Analyzers).” |

In this Chapter
Using FieldFox’s analog demodulation, users maintaining AM/FM radio systems can demodulate and characterize AM and FM signals. They can tune to the signal and listen to the audio tones using FieldFox’s built-in speakers or a headphone. They can also display the RF spectrum, the demodulated waveform and AM/FM metrics such as carrier power, modulation rate, and SINAD.
AM/FM Metrics enables you to make the following measurements:
And, can be enabled/disabled simultaneously with Tune and Listen.
If you are familiar with the AM/FM measurements and terms, skip to “How to Set Up AM/FM Metrics” on page 708.
—Connect a test tone to the FieldFox SA Port 2 (Port 2)
—Press Measure > Analog Demod Tune & Listen > Analog Demod
Selecting FM Wide vs. FM Narrow does not effect the displayed waveforms or metrics. But, if you are using the Audio Demod feature and listening to the demodulated waveform, then select the appropriate FM type, because the tones do differ based on the FM type selected. Refer to Table 27-1 on page 706. Chapter 9, “SA (Spectrum Analyzer) Mode (Option 233–Mixed Analyzers)” and to “Analog Demod” on page 180. |
Left display - Frequency Spectrum (Power vs. Frequency)
Right display - Demodulated waveform vs. time where Demod SwpT sets the width of the demod window.
—Then Freq/Dist > Center to set the carrier frequency.
—Set Freq Span so that all sidebands above -60 dB are displayed in the left window.
—Optionally, adjust the AF Res BW to better iden side bands. Le Chapter 9, “SA (Spectrum Analyzer) Mode (Option 233–Mixed Analyzers)” and “AF RBW (Audio-Frequency Resolution BW)” on page 198.
—Optionally, Freq/Dist > Tune & Listen OFF. Tune & Listen can be set when you are in Analog Demodulation mode, so you can enable Tune & Listen sweeps in between your Analog Demod sweeps
Metrics are displayed in the AM/FM Modulation Metrics table on the FieldFox. For AM and FM Metrics examples, refer to Figure 27-1 through Figure 27-8 on page 717.
Figure 27-1 AM Metrics - Example 1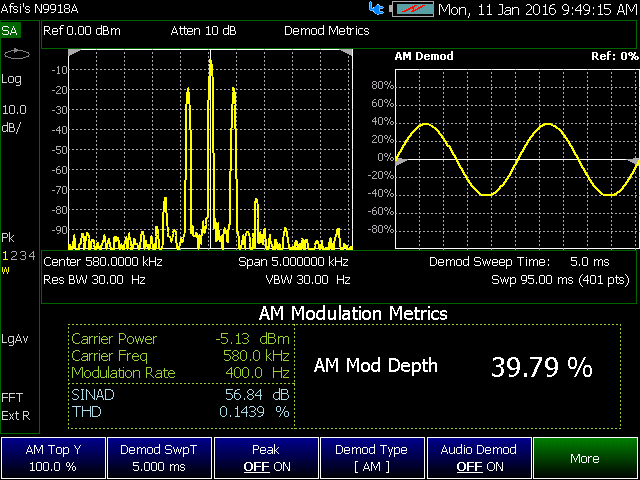
Figure 27-2 AM Metrics - Example 2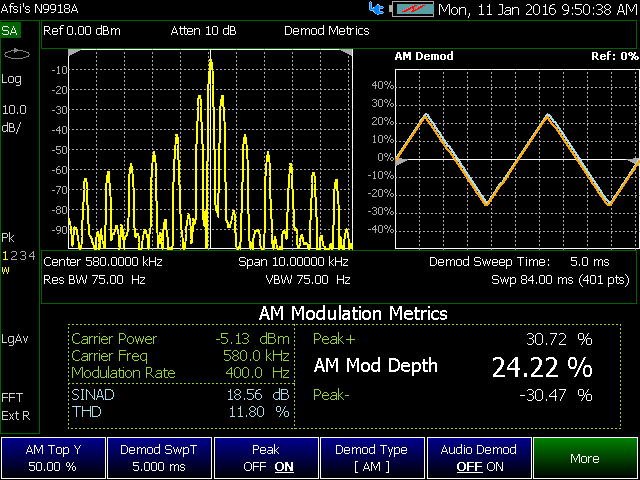
Figure 27-3 FM Metrics - Wide band Example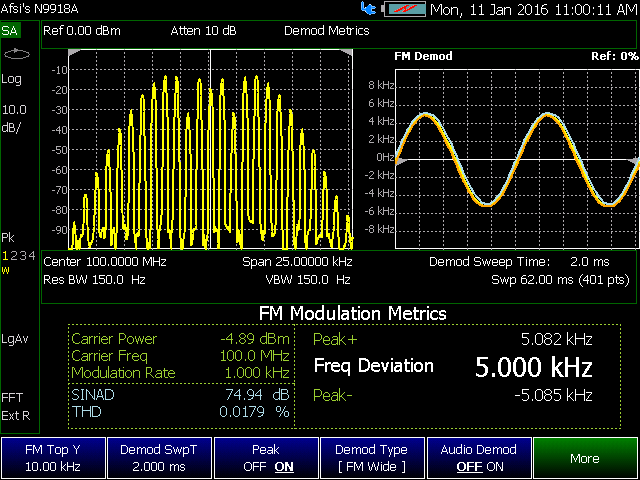
—FieldFox converts the audio waveform to the audio frequency spectrum using an FFT (i.e., The FFT result is not displayed). Refer to Figure 27-4 on page 712.
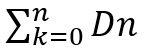
—The FFT waveform is used to calculate SINAD and THD distortion metrics
—The fundamental signal, harmonics, and noise from 0 Hz to 24 kHz are applied to the formulas. Refer to Figure 27-5 on page 713.
—For more on calculations, refer to “Overview of Measurement Types” on page 706.
—See also, https://www.keysight.com/us/en/assets/7018-04493/application-notes/5991-4913.pdf.
Figure 27-4 Audio Waveform with FFT Calculations
Figure 27-5 SINAD and THD Results - Example 1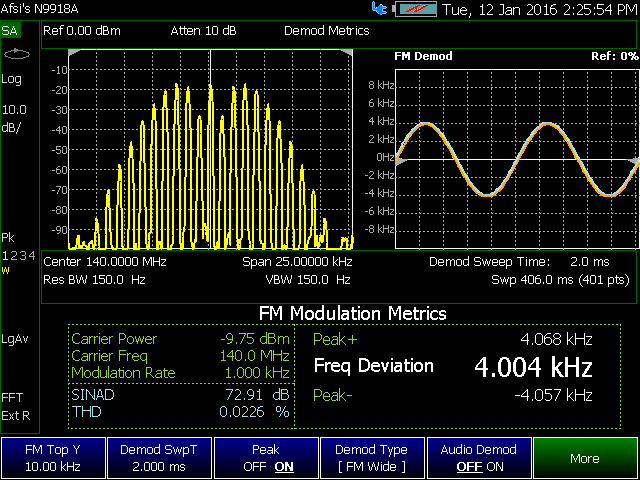
Figure 27-6 SINAD and THD Results - Example 2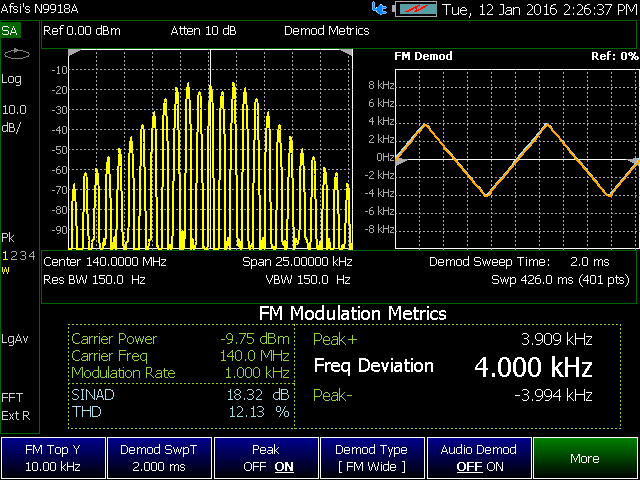
Interpreting AM/FM Metrics Error Messages
This section discusses possible AM/FM Metrics error messages and how to correct them.
Test Tone Not Found
A Test Tone Not Found message is displayed under the following circumstances:
—FieldFox frequency span is too wide
—No side lobes are displayed in the results
Refer to the examples in “Test Tone Not Found - Example” on page 716 and “Test Tone Not Found - Corrected Example” on page 717.
The following response had the following settings:
—Source CF: 140 MHz
—FM Deviation: 18 kHz
—Modulation Rate: 1 kHz
Reasons for error:
—Frequency span of 1.0 MHz is too wide
—No side lobes displayed, so test tone not found
Figure 27-7 Test Tone Not Found - Example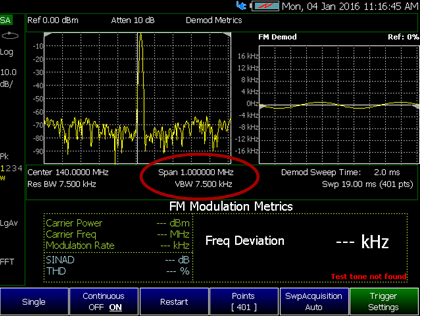
Test Tone Not Found - Corrected Example
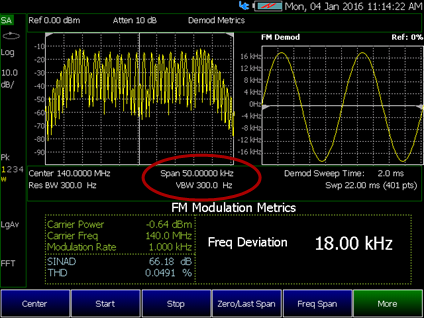
The following response was corrected with these setting changes:
—Frequency set to narrower frequency span of 50 kHz
—Ideally the frequency span should show the modulation envelope down to –60 dB below the RF power level
Response corrected, because:
—Narrowing the frequency span enables the modulation envelope’s side lobes to be identified
—FM algorithm identifies the side lobes
—The algorithm matches the modulation envelope to the mathematically calculated FM modulation or distortion patterns