In Data Link, you can create a new Distance to Fault plot from a CAT mode Return Loss plot or a NA mode S11 plot.
Click Tools, then Distance to Fault

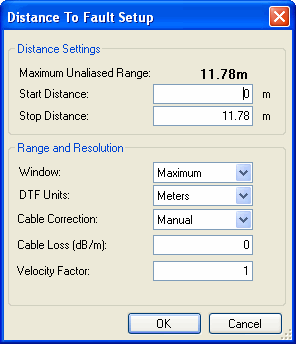
Distance To Fault dialog |
The following settings are used to perform a Inverse Fast Fourier Transform (IFFT) of the Frequency Domain data. When finished, press OK to generate the DTF plot. Note: Markers can NOT be added to the resulting Distance to Fault plot. Distance SettingsAn alias fault is not a true device response. An alias fault appears because of the method used to convert frequency to time. Maximum Unaliased Range The total (stop - start) distance that could be guaranteed to NOT see an alias response. This range is related to the frequency range of the CAT measurement. For a larger unaliased range, choose a smaller range of measurement frequencies. Start / Stop Distance The X-axis distance to show on the plot. Range and ResolutionWindow Provides the ability to choose between optimizing DTF measurements for resolving closely-spaced faults or for the ability to measure low-level faults. Choose from the following:
DTF Units Choose from Feet or Meters. Cable Correction By default, the FieldFox does NOT compensate DTF measurements to account for the inherent loss of a cable. However, to make more accurate DTF measurements, the cable loss and velocity factor can be entered using one of the following methods:
Cable Loss (dB/m) - Cable loss is directly proportional to the length of the cable and the frequency of the signal that passes through the cable. Only one Loss value can be used for the entire frequency range of the measurement. Velocity Factor - Velocity Factor is a property of the physical material of a cable. A VF of 1.0 corresponds to the speed of light in a vacuum, or the fastest VF possible. A polyethylene dielectric cable has VF = 0.66 and a cable with Teflon dielectric has VF = 0.7. |
Date Last Modified:
27-Sep-2011 |
Added Markers note |