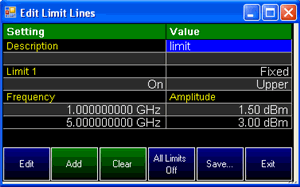
Limit Lines are visual representations on the plot of the specified limits for a measurement. Data points that exceed the Limit are marked with a RED Dot. With this capability, you can easily compare measured data versus specifications.
The Data Link Limit Line Editor is launched in two ways:
With a *.sta file displayed, click Tools, then Limits, then Edit Limits.
The limit lines can be edited in exactly the same manner as they are in the FieldFox.
Click Exit to display your edits on the displayed plot.
When finished editing, click Tools, then Limits, then Save As to save an *.xml file to the PC.
To save them to the FieldFox, use the Send to Instrument procedure.
Open a Limit Line *.xml file that is stored on the FieldFox.
Right-click the instrument, then Show Files.
Double-click the Limit Line *.xml file.
The limit lines can be edited in exactly the same manner as they are in the FieldFox. Build from Trace is not available.
When finished editing, click Save As to save to the PC as an *.xml file.
To save them to the FieldFox, use the Send to Instrument procedure.

Enter X/Y data points into the editor. The limit line is formed as the FieldFox ‘connects the dots’ on the screen.
To create frequency gaps that are NOT tested, use separate limit lines.
The X-axis values for two lines can overlap.
Use your mouse or keyboard arrow keys to navigate the cursor to the following editable cells.
Description - Press Edit, then enter a description for the limit line.
Fixed/Relative – Press Edit to toggle between the following:
Note: This setting is available ONLY when editing the limits on a plot; NOT when editing an *xml file.
Fixed - the limit line does not move. The X/Y coordinates are absolute locations on the screen.
Relative - the limit line moves relative to the center frequency and reference level. Note: It is easiest to first create Fixed Limits, then change this setting to Relative.
Upper/Lower – Press Edit to toggle between the following:
Upper - FAILS any measured data point ABOVE the line.
Lower - FAILS any measured data point BELOW the line.
Off/On – Press Edit to toggle between the following:
On - Limit line is drawn on the screen and PASS/FAIL testing occurs.
Off - Limit line is NOT drawn on the screen and testing does NOT occur.
Frequency/Time - Enter a numeric X-axis value.
Amplitude - Enter a numeric Y-axis value of the data point.
Press Add then choose from the following:
Add Point - Adds a blank X/Y data point below the cursor.
Add Limit - Adds a default limit line below the current limit.
Press Clear then choose from the following:
Clear Point - Removes the X/Y data point on which the cursor resides.
Clear Limit - Removes the limit Line on which the cursor resides.
Clear All - Removes ALL limit lines.
Click Exit to close the Limit Line editor.
Date Last Modified:
27-Sep-2011 |
Added Smith chart note |