Click Display to make the following settings:
Trace Math - Statistics (NOT available on Opt 002)
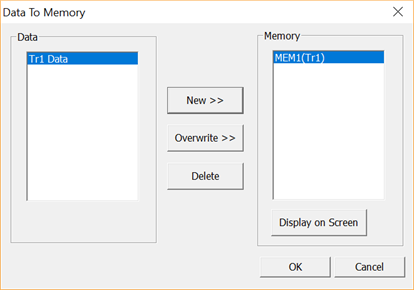
This dialog copies a displayed trace into memory. You can then display the Memory trace. This allows the original trace to be compared to the stored trace. An unlimited number of traces can be stored into memory.
Click Display, then Data >Memory
Data - Lists the traces that are displayed.
Memory - For each displayed Data trace, lists the traces that are stored into memory.
From the Data column, select a trace to store into memory.
Click New >> to copy that trace into memory.
Click Display on Screen to display the selected Memory trace.
To replace a memory trace with updated or different data, select a Data trace to store, select the memory trace to replace, then click Overwrite >>. Again, click Add.
To remove a trace from memory, select the Memory trace, then click Delete.
Trace math is performed between two or more traces in the current chart. The default format for a new math trace is e' or Log Mag for S-parameters. The format can be changed by right-clicking on the trace name or by clicking the Chart menu.
Click Display, then Trace Math
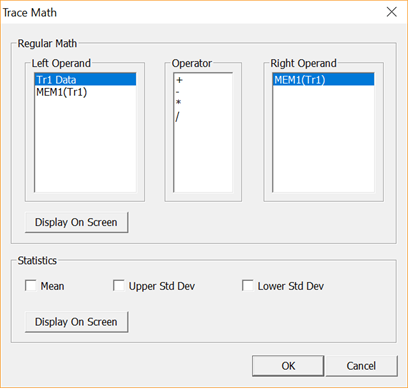
Select a chart that contains the traces on which Trace Math is to be performed.
Select a Left Operand, Operator, and Right Operand.
Click Display On Screen to create an Equation trace in the current chart.
For example, to perform Data / Memory (as shown in this dialog).
Store a trace into Memory using the Data > Memory dialog.
Select the following:
Left Operand = Tr1
Operator = '/' (divide)
Right Operand = MEM1 (Tr1)
Click
Display On Screen to create
a new 'Tr2 Eq' trace. The
equation that created the trace is shown in the upper right corner
of the chart ![]()
This feature creates additional traces in a chart that represents the Mean, Upper, and Lower Standard Deviation of the existing traces in the chart.
Click Display, then Trace Math
Check one or more statistics to add.
Click Display On Screen.
A new trace is added to the chart for each 'checked' statistic.
This chart contains e' and e" traces. The three additional Statistics traces were added using this feature.
Statistics are calculated for each data point of all traces in the active chart.
Calculations and plotting of the statistical traces occurs real time. Additional measurement traces can be added or removed and the statistical traces are updated automatically.
The UPPER and LOWER Standard Deviation values are determined as follows:
MEAN = Average of traces
UPPER = Mean + (Std Dev / 2)
LOWER = Mean - (Std Dev / 2)
Calculations are performed on any number of existing traces up to the maximum. The statistical traces are counted towards the maximum number of traces per chart.
There can be up to 9 markers for each data trace, plus one Reference marker.
Click Display, then Marker
Select one of the 9 regular markers.
Set At: Select an initial X-axis location for the marker.
Check On to create the marker.
Click on the marker pointer and drag to any location on the X-axis.
Markers on Cole-Cole traces can be moved ONLY by scrolling with the mouse wheel.
Choose from the following dialog settings:
Coupled Markers Check (default setting) to cause markers in different charts, on different traces, to all move across the X-axis simultaneously.
Delta Marker Check to make the active marker display data that is relative to the reference (R) marker. There is only one reference marker per trace. All nine other markers can be regular markers or delta markers. When a delta marker is created, if not already displayed, the reference marker is displayed automatically. A delta marker is shown in the
Discrete Marker Clear (default setting) to display values that are interpolated from the data points. The interpolated marker will report Y-axis data from ANY frequency value between the start and stop frequency.
Check to display values at only the discrete points where data is measured.
All Markers Off Click to turn OFF all markers on the trace.
Note: Move a marker by clicking on, then dragging the marker along the X-axis. Or use the right-click feature. See below.
The Marker Readout area is in the upper-right corner of each chart.
![]() A Delta marker is shown with a delta
sign to the left of the marker number.
A Delta marker is shown with a delta
sign to the left of the marker number.
![]() The 'Active' marker is shown with > to the left
of the marker number.
The 'Active' marker is shown with > to the left
of the marker number.
Click the relevant trace to activate, then:
Create a regular marker: Right-click, then Marker, then Insert.
Move a marker to a precise X-axis location: Activate the marker, right-click, then Marker, then Set At, then enter the X-axis location.
Delete a marker: Activate the marker, right-click, then Marker, then Delete.
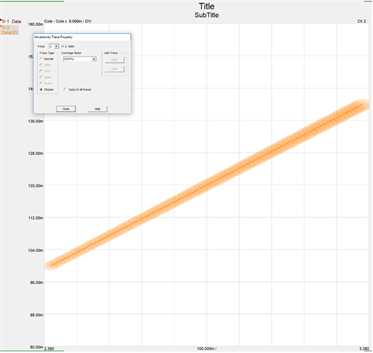
This dialog allows uncertainty trace properties to be changed.
Note: Only the Nicholson-Ross model supports uncertainty and the VNA must have Option 015 (S93015A/B).
Click Display, then Uncertainty
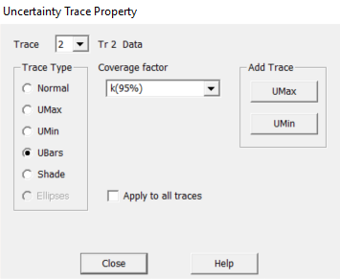
Trace Selects the trace to apply uncertainty.
Normal Selects the normal trace type.
UMax Selects the maximum value considering uncertainty.
UMin Selects the minimum value considering uncertainty.
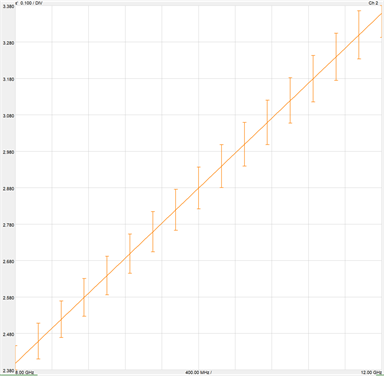
UBars Selects error bars as shown below:
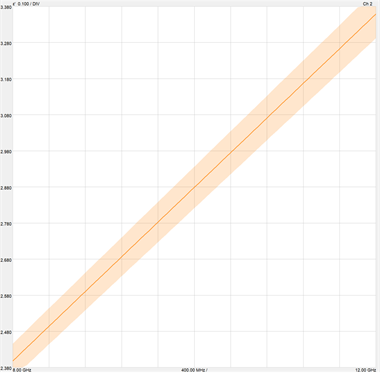
Shade Selects uncertainty shaded region as shown below:
Ellipses This selection becomes active if the trace is in polar, smith, or Cole Cole parameters. Ellipses displays the uncertainty area when both x and y data have uncertainty as shown below:
Coverage factor Changes the coverage factor from 1 to 4 which corresponds to 66%, 95%, 99% and above 99%.
Apply to all traces check to set all traces to the desired Coverage factor.
Add Trace Adds a new trace set to the max (UMax) or min (UMin).
Last modified:
28-Sep-2020 |
Updated Data To Memory and Trace Math |
22-Apr-2020 |
Added Uncertainty section |
20-Nov-2012 |
Major edits |