When an S-parameter trace is present, the following formatting choices appear at the top of the Chart menu and as icons on the following toolbar (shown from left to right):
![]()
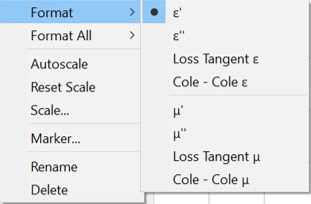
For Options 001, 002, 004, 005, 006, right-clicking on trace name displays a menu for changing the trace format:
Displays Magnitude (no phase)
Y-axis: dB
Typical measurements:
Return Loss
Insertion Loss or Gain
Displays positive values only
Y-axis: Unitless (U) for ratioed measurements
Watts (W) for unratioed measurements.
Typical Measurements:
reflection and transmission coefficients (magnitude)
time domain transfer
Measures the phase of a signal relative to the calibration reference plane with a range of +/- 180 degrees.
Displays Phase (no magnitude)
Y-axis: Phase (degrees)
The trace 'wraps' every 180 degrees for easier scaling.
Same as Phase, but without 180 degree wrapping.
Note: Phase is unwrapped by comparing the phase from one data point to the next. If the phase difference between two points is greater than 180 degrees, or if the phase of the first data point is greater than 180 degrees from DC, than the phase measurement is probably NOT accurate.
Displays signal transmission (propagation) time through a device
Y-axis: Time (seconds)
Typical Measurements:
Group Delay
The Smith chart is a tool that maps the complex reflection coefficient (G) to the test device's impedance.
In a Smith chart, the rectilinear impedance plane is reshaped to form a circular grid, from which the series resistance and reactance can be read (R + jX).
You can use Markers to display the following:
Resistance (in units of ohms)
Reactance as an equivalent capacitance (in units of farads) or inductance (in units of henrys)
Polar format is used to view the magnitude and phase of the reflection coefficient (G) from your S11 or S22 measurement.
You can use Markers to display the following:
Linear magnitude (in units) or log magnitude (in dB)
Phase (in degrees)
Displays only the real (resistive) portion of the measured complex data.
Can show both positive and negative values.
Y axis: Unitless
Typical Measurements:
time domain
auxiliary input voltage signal for service purposes
Displays only the imaginary (reactive) portion of the measured data.
Y - axis: Unitless
Typical Measurements:
impedance for designing matching network
Displays reflection measurement data calculated from the formula (1+r)/ (1-r) where r is reflection coefficient.
Valid only for reflection measurements.
Y axis: Unitless
Typical Measurements:
SWR