
By default, plots are labeled with the first parameter that they display. These labels can be changed to text of your choice. Labels are limited to 22 characters in length.
To rename a plot:
Right click on the plot, then click Rename Plot. Type a new Plot name and click OK.
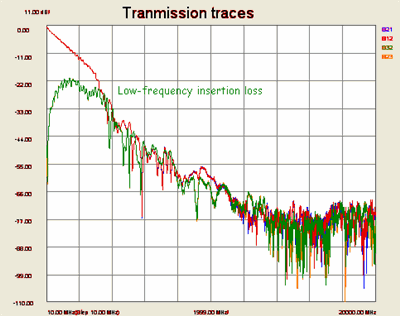
The plot above has been renamed to Transmission traces.
You can add a custom annotation to any plot window as in the above image. The length of a single annotation label is limited by the width of the plot. Add as many annotation labels as you like to a plot.
By default, annotations are limited to being positioned only within the plot area (canvas) of the window. In User Preferences, however, you can enable annotations to be positioned anywhere in the window by unchecking "Limit Annotation's Position into Canvas."
The plot above has been annotated with Low-frequency insertion loss.
To add annotation:
Right-click the plot window, then click Add Annotation.

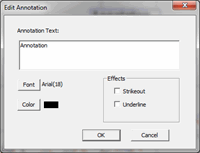
Add text. Press Enter in the annotation text to create multi-line annotations.
Optionally change the Font, Size, Style, and Color. Press OK.
Once added, click and drag the annotation to move the text.
To edit or delete the text, right-click the annotation, then click Edit or Delete.
To easily copy annotation to other plots:
Select the annotation on a plot, then on the keyboard press ctrl + c.
Select another plot, then press ctrl + v.
To further aid in identifying traces, you can add descriptive legends to a plot window.
To add legends:
