General Tab
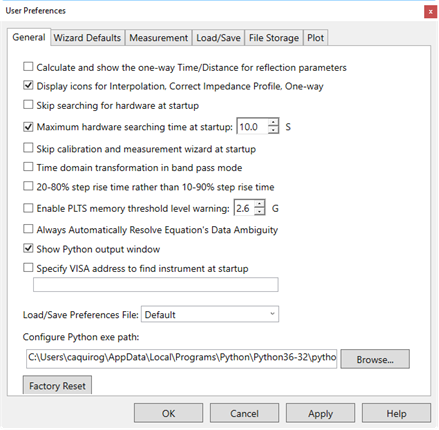
Calculate and show the One-way Time / Distance for reflection parameters Check to show VNA Time Domain reflection parameters as one-way time or distance. Even though the signal travels up a device and back, the data is automatically divided by two.
When icons are enabled (see following preference)
this icon ![]() is shown
in the upper-right corner of reflection parameters plots to indicate
the data is shown in one-way time or distance.
is shown
in the upper-right corner of reflection parameters plots to indicate
the data is shown in one-way time or distance.
Clear this box to show the two-way time or distance.
Display Icons for Interpolation, Correct Impedance Profile (Peeling), One-way Time/Distance When checked, all three icons are enabled and show on the plot when appropriate. When cleared, these icons never appear on plots, although the feature may be enabled.
Skip searching for hardware on startup When you primarily use PLTS studio (analysis mode), check this box and PLTS will be launched in Analysis Mode.
Maximum hardware searching time at startup Sets the time to search for hardware before it displays a message indicating no hardware could be found.
Skip calibration and measurement wizard at startup Check this box and PLTS will not display calibration and measurement wizard at startup.
Time Domain Transformation in Band Pass Mode All Time Domain plots are calculated using a Band Pass mode algorithm. Learn more.
20-80% step rise time rather than 10-90% step rise time Check to use 20-80%. Clear to use 10-90% (default setting). These percentages are used Rise Time measurement, the display of Rise Time in the Window settings dialog, and the Eye Diagram measurement results.
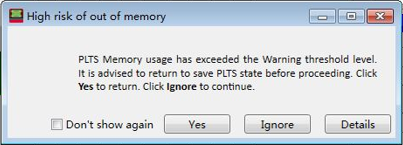
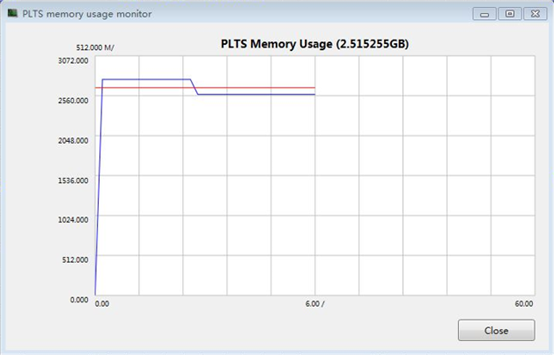
Enable PLTS memory threshold level warning Check this box and set the memory threshold size to avoid an out of memory condition. If the memory threshold is exceeded, a warning is displayed. Click Yes to return, Ignore to continue, or Details to display the PLTS memory usage monitor. Check the Don't show again box to disable the warning from being displayed.
Always Automatically Resolve Equation's Data Ambiguity Check this box to always use the ACTIVE (selected) file in the equation. Learn more.
Show Python output window Select to show the Python output window.
Specify VISA address to find instrument at start up When checked, PLTS connects to the LAN-connected instrument at the VISA address below.
Configure the LAN-connected instrument in Keysight IO Libraries. Learn how.
Copy the VISA address from Keysight IO Libraries.
Start PLTS and check this box.
Paste the address in the text box as shown in the image above. The next time it is started, PLTS will attempt to connect to the instrument at this address.
Load/Save Preferences File: You can save an unlimited number of User Preferences files that store all of the User Preference settings. For example, you can load various files for different devices or different users.
To create a new Preferences file, select settings on this Wizard Defaults tab, then type a unique name in this field. When the OK button is clicked, the new file is saved and automatically becomes the default preferences file that is loaded when PLTS is started.
To load an existing Preferences file, click the down arrow and select a different file.
To edit an existing Preferences file, load that file, then check or clear the relevant Preferences settings. Click OK to save the new settings to the existing file.
Configure Python exe path: Enter the default path for the Python executable file.
Factory Reset Click to cause all preference settings to revert to their factory defaults.
Wizard Defaults Tab
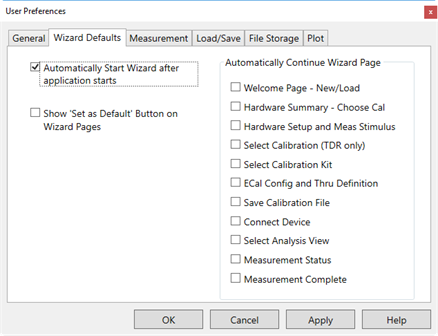
Automatically Start Wizard after application starts. Check to cause the Measurement Wizard to begin automatically after PLTS begins.
Show 'Set As Default'' Button on Wizard Dialog Pages Check to cause the following buttons to appear on all Wizard pages. Use these buttons, in conjunction with a Preferences File, to streamline your measurement setup to prompt for only the information that is required by your unique setup.
![]()
Automatically Continue Wizard Page
All of the Measurement Wizard pages are listed along with check boxes.
When checked, the corresponding wizard page is NOT launched, but continues using the default settings on that page. Use this feature along with the Set As Default button to streamline measurement setups.
Measurement Tab
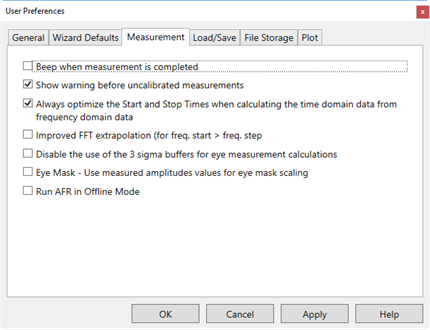
Beep when measurement is complete Causes the PC to beep when the measurement is complete.
Show warning before uncalibrated measurements Causes a message to be displayed that indicates you are about to make an uncalibrated measurement.
Always optimize the Start and Stop Times when calculating the time domain data from frequency domain data When checked, the time domain Start and Stop times are optimized for best viewing. This selection affects the Time Domain Start and Stop Time dialog box default optimize selection.
Improved FFT extrapolation When checked, while calculating Time Domain response, if the start frequency is greater than the step frequency (for example: start = 50MHz, step = 10MHz), PLTS will extrapolate to DC using the step frequency in frequency domain. Learn more about Time Domain transform.
Disable the use of the 3 sigma buffers for eye measurement calculations See Eye Diagram Preferences shortcut.
Eye Mask - Use measured amplitudes values for eye mask scaling See Eye Diagram Preferences shortcut.
Improved Precision of De-embedding Process Check this option when DUT insertion loss is far less than reflection for a better result.
Run AFR in Offline Mode Check to run AFR in offline mode.
Use Switch Matrix Use the L8990M switch matrix support function in Keysight VNA enhanced TDR and L8990M switch matrix for multi-port test.
Load/Save Tab
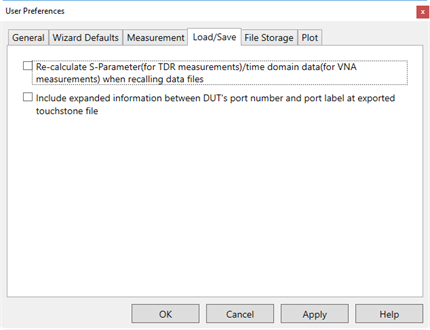
Re-calculate S-parameters(for TDR measurements) / time domain data(for VNA measurements) when recalling .DUT files
Both frequency and time domain data can be stored in *.dut files. For TDR measurements, time domain data is measured and the S parameters are calculated. For VNA measurements, the S parameters are measured and the time domain data is calculated. When checked, recalculations of the data occur when a *.DUT file is opened.
Include expanded information between DUT's port number and port label at exported touchstone file
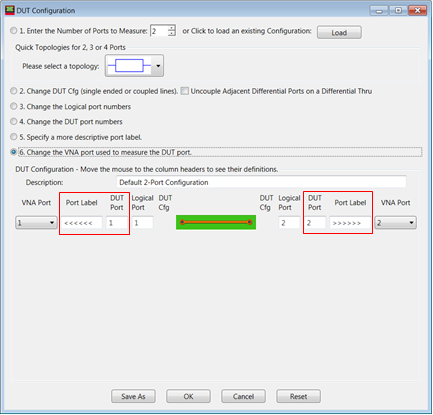
Check this box to include information about the DUT's port number and port label in the exported Touchstone file. See below for an example:
!1:<<<<<<
!2:>>>>>>
To change the port number and port label, at the PLTS Wizard Welcome dialog, select New Measurement, then Next, then click Edit. In the DUT Configuration dialog, select 6. Change the VNA port used to measure the DUT port.
File Storage Tab
For all selections:
When checked, the specified file storage location is used by default. In many cases, this location can be changed during the file save operation.
When NOT checked, the file storage location that was last used will appear in the dialog that performs any of the above listed File Save operations.
Adapters - *.txs files used in Adapter Characterization and Reference Plane 2-port De-embed
Calibration:
*.cal files from a competed VNA 'legacy' calibration
*.tdr files from a completed TDR calibration
*.wzd files from a Multimode TRL Calibration
*.sNp files from measuring Multimode TRL standards
*.mkt files from Multimode TRL Cal Kits
*.xml files from criteria for continuity check
Exported Data:
Many file types from Export Data.
Many file types for Output to Batched File Converter
De-embedding Data - Many file types for all Reference Plane De-embedding paths.
Digital Patterns - Many file types that have been designed or imported for Eye Diagrams.
Formulas - *.fml files from Load/Save Math formulas
*.DUT files from Open / Save
Many file types for Add to Batched File Converter and Batched Reference Plane Adjustment.
File name prefix for auto naming - When the following "Auto save.." preference is checked, this text is used as a prefix for the new data filename, followed by the next integer. For example, MyFile1.dut, then MyFile2.dut, and so forth.
Auto save new measured data to "Measurement Data" directory - Check to automatically save ALL measurement data. When you close PLTS, you will NOT be prompted to save your data. The above "File name" setting specifies the filename.
Plot Tab
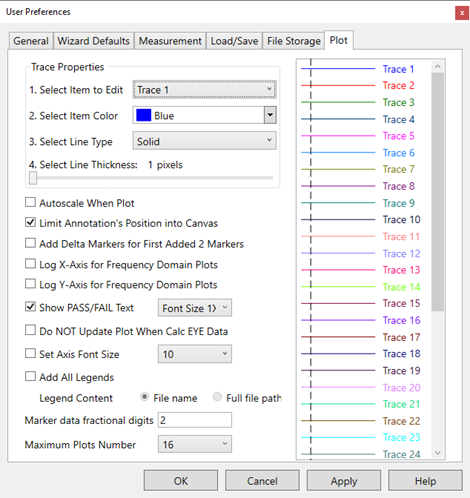
Note: Beginning with PLTS 2020, plots are refreshed immediately after changing trace color and line type. In addition, the plots are refreshed after changing line thickness and axis font size.
Trace Properties For each trace, allows you to set the color, type, and thickness of traces as they will appear on the display. These properties can ONLY be set globally as a User Preference. They can NOT be set individually for each trace.
Autoscale When Plot When checked, plots are Autoscaled as the plot is displayed. When cleared, plots are set to default scaling when loaded. Plots can then be scaled as required. Learn how.
Limit Annotation's Position into Canvas When checked, you can position annotations only within the plot area (canvas) of the window. When unchecked, you can position annotations anywhere in the window. See Plot Annotations and Legends.
Add Delta Markers for First Added 2 Markers When checked, as markers #1 and #2 are added, a third set of readouts displays the differences between these two markers. See Markers.
Log X-Axis for Frequency Domain Plots When checked, all frequency domain plots are appear with a logarithmic X-axis, regardless of the sweep type in which the data was measured. When cleared, all frequency domain plots appear with a linear X-axis.
Show PASS/FAIL Text When checked (default setting), PASS or FAIL appears on all Plots with Limit Line or Eye Mask test enabled. When cleared, no PASS / Fail indication appears.
Font Size 1X - Choose a font size for the Pass/Fail text.
Do NOT Update Plot When Calc Eye Data See Eye Diagram Preferences shortcut.
Set Axis Font Size
Checked: Choose a font size for the X and Y axis that will apply to both multi-plot window and a single plot window.
Cleared: The multi-plot window and single plot windows have separate and non-selectable font sizes.
Add All Legends When checked, all legends are added to the plot. Also, select to add File name only or full file path.
Add Single Point Legend The single-point legend does not appear on the plot by default. To make it visible, do the following:
- In the Data Browser, open data in Template View > Create New.
- In Tools > User Preferences > Plot tab, check the option “Add Single Point Legend."
- In the Parameter Format Selection pane, select Equation and click iRL.
Marker data fractional digits Enter the number of significant digits to display on the Marker Readout. Choose a value between 1 and 10. Learn more about Markers.
Specify Decimal Places for Y-Axis Enable and enter the number of decimal places to be displayed on the Y-axis.
Specify Decimal Places for X-Axis Enable and enter the number of decimal places to be displayed on the X-axis.
Maximum Plots Number Choose 16 to 144 plots to be viewed in the PLTS screen.