See All Spectrum Analyzer Examples
This measurement example helps you understand the basic operation of the Spectrum Analyzer application and how to optimize the measurement setup to avoid instrument-generated spurious responses. This example measures the harmonics at maximum gain of an amplifier and confirms that the harmonics are solely caused by the amplifier, not by the PNA source or receivers.
On the PNA front panel, press Preset.
Press Power.
Press [Power Level] and set the Port 1 source power to be in a linear region of the amplifier's output response.
Press Freq and set the start/stop frequency to measure the gain across the amplifier's frequency range.
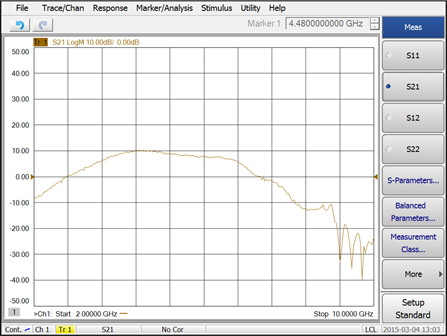
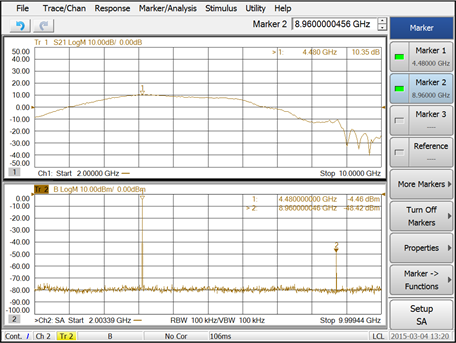
Press Meas and select [S21]. You should see the amplifier's frequency response as shown in the following example.
Press Search then [Max] to place a marker on the maximum gain.
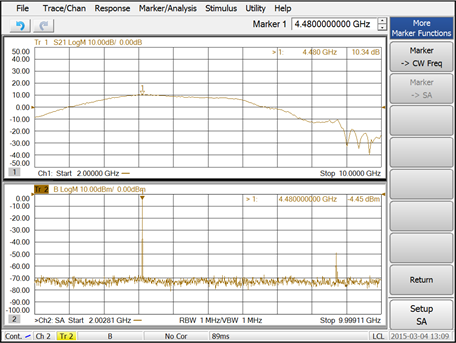
Press Marker, [Marker -> Functions], [More], [Marker -> SA] to view the amplifier's spectrum at the maximum gain. Note that a second channel with Spectrum Analyzer mode is created as shown in the following example.
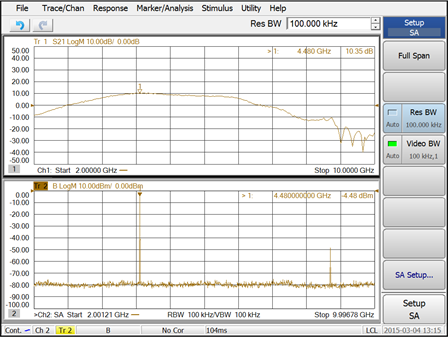
Press [Setup SA] then [Res BW] and adjust (narrow) the resolution bandwidth to lower the noise floor. The following example shows the lowered noise floor after changing the resolution bandwidth from 1 MHz to 100 kHz.
Press Marker then [Marker 2] and place the marker on the second harmonic level as shown in the following example.
The receiver will be validated by monitoring the amplitude of the 2nd harmonic while increasing the receiver B attenuator. The resolution bandwidth will be adjusted if necessary to lower the noise floor. The receiver B attenuator will only affect the power input to the receiver thus affecting the receiver harmonics. However, it does not affect the DUT’s 2nd harmonic. Therefore, if the measured 2nd harmonic does not change when the receiver B attenuator is changed, the receiver B is not contributing the 2nd harmonic measurement.
Press [Setup SA] then [SA Setup].
Increase the Receiver B attenuation then click Apply. Refer to the following example.
Monitor the 2nd harmonic amplitude for any changes.
To validate the source, an R1 trace is added and source attenuation is increased to verify if a 2nd harmonic signal is being generated from the Port 1 source.
When source attenuation increases but the set Port 1 output power remains the same, the source outputs more power to maintain the set Port 1 output power. The R1 coupler is before the source attenuator thus it sees higher power from the source than that with the lower source attenuator setting. At a certain point, R1 is compressed and starts generating the 2nd harmonic.
As the R1 receiver has no step attenuators, to verify if it is the source or the R1 receiver generating the harmonic, measure the same harmonic signal with receiver B but without the DUT (using a Thru connection from Port 1 to Port 2). Attenuators may be added to the receiver B to avoid compression and the resolution bandwidth can be adjusted to lower the noise floor. If receiver B sees the harmonic signal, it is from the source (or both); If the R1 receiver sees the harmonic but receiver B does not, the harmonic is due to the R1 receiver compression.
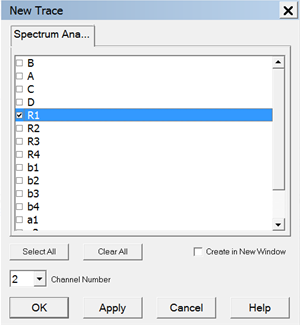
From the menus across the top of the display, click Trace/Chan, Trace, New Trace, select R1 to add an R1 trace, then click OK. Refer to the following example.
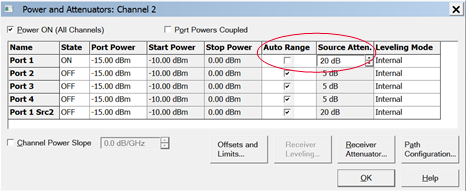
Press [Setup SA], [SA Setup], Source Setup tab, then Power and Attenuator button.
Deselect Auto Range for Port 1, increase Source Atten to 20 dB, click OK, then click OK in the Source Setup tab. Refer to the following example.
Monitor the 2nd harmonic on the R1 trace for any changes.
Press [Setup SA], [SA Setup], Source Setup tab, then Power and Attenuator button.
Increase Source Atten to 30 dB, click OK, then click OK in the Source Setup tab. Refer to the following example.
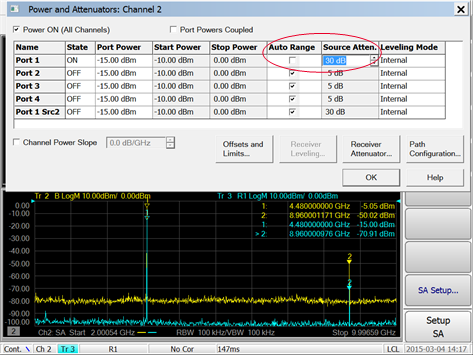
Monitor the 2nd harmonic on the R1 trace for any changes.