When making an S11 or S22 measurement of your device under test, you can view complex-impedance data such as series resistance and reactance as well as phase and magnitude information. Complex impedance data can be viewed using either the Smith Chart format or the Polar format.
Complex-impedance data is information that can be determined from an S11 or S22 measurement of your device under test, such as:
Resistance
Reactance
Phase
Magnitude
The amount of power reflected from a device is directly related to the impedances of both the device and the measuring system. For example, the value of the complex reflection coefficient (G) is equal to 0 only when the device impedance and the system impedance are exactly the same (i.e. maximum power is transferred from the source to the load). Every value for G corresponds uniquely to a complex device impedance (as a function of frequency), according to the equation:
ZL= [(1 + G) / (1 - G)] ´ Z0
where ZL is your test device impedance and Z0 is the measuring system's characteristic impedance.
Complex Impedance is best viewed using either Polar or Smith Chart format.
The Smith chart is most easily understood when used with a full scale value of 1.0.
For greater accuracy when using markers in the Smith chart or polar formats, activate the discrete marker mode.
The uncertainty of reflection measurements is affected by:
Directivity
Reflection tracking
Source match
Load match (with 2-port devices)
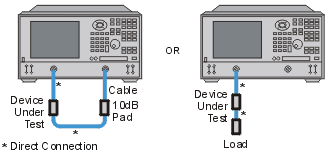
With a 2-port calibration, the effects of these factors are reduced. A 1-port calibration provides the same accuracy if the output of the device is well terminated. Refer to the graphic below for the following discussion.

If you connect the device between both analyzer ports, it is recommended that you use a 10 dB pad on the output of the device to improve measurement accuracy. This is not necessary if you use a 2-port calibration since it corrects for load match.
If you connect a two-port device to only one analyzer port, it is recommended that you use a high-quality load (such as a calibration standard) on the output of the device.
How to Measure Complex Impedance
Connect the device as shown in the previous graphic.
Preset the analyzer.
Set up, calibrate, and perform an S11 or S22 measurement.
View impedance data:
Select the Smith Chart format.
Scale the displayed measurement for optimum viewing.
Position the marker to read the resistive and reactive components of the complex impedance at any point along the trace.
View the magnitude and phase of the reflection coefficient:
Select the Smith chart format or the Polar format.
Select either Lin Marker or Log Marker formats.
Scale the displayed measurement for optimum viewing.
Position the marker to read the frequency, magnitude, and phase of the reflection coefficient (G) at any point along the trace.