Binary transfer of eye diagram data
This Python example, binary-transfer-eye.py, performs a binary transfer of an eye diagram waveform. The resulting data is shown in a matplotlib window. If you do not wish to import matplotlib library, comment out the draw_graph() function.
The main purpose of this program is to demonstrate how to return binary eye diagram data with the graph used as a visual confirmation that the data was correctly interpreted. The example works with Infiniium offline and installs simulated instruments. No hardware is required. This script imports matplotlib for the graph.
As shown in the following code, query_binary_values() method, is used to return the data.
eye_data = Infiniium.query_binary_values(message,
                                      datatype='L',
                                      container=list,
                                      is_big_endian=False,
                                      header_fmt='ieee')
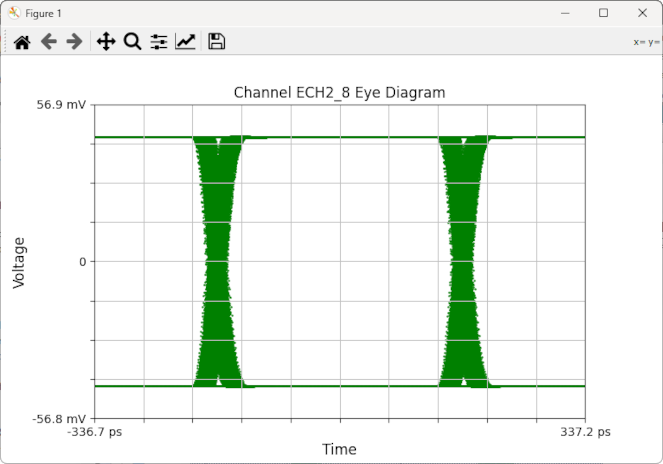
As described in :WAVeform:CGRade:INTeger:DATA?, the returned data is 391,271 points (1,565,084 bytes). This array corresponds to the graticule display, where each point contains a sample hit count. The array is transferred column by column, starting with the lower left corner of the graticule.
The following picture shows an example of the displayed graph.
Example Script
waveform-cgrade-integer-data.py
#!python3

"""This program illustrates, in the Infiniium XR8
oscilloscope, the transfer of binary eye data to the PC.
The draw_graph() function shows a graph of the data in a
matplotlib GUI window. If you do not wish to import matplotlib
library, comment out this function.
"""

# Import modules.
import pyvisa
import sys
import time
import numpy as np
import matplotlib.pyplot as plt
from matplotlib.ticker import EngFormatter
import platformdirs

# Global variables.
oscilloscope_visa_address = "TCPIP0::localhost::hislip0,4880::INSTR"
timeout = 60000  # 60 seconds.

# Save Locations
base_file_name = "my_cggs"
local_base_directory = f"{platformdirs.user_documents_dir()}\\"


def draw_graph(bin_data, datasize, labels, source):
    """Plots binary data and saves graphics file to show
    that we received the data from Infiniium. Data is not
    amplitude and time values but rather, for each database
    row and column, an integer count of number of hits.
    A 0 value indicates not hits for the point.
    """

    print("Drawing graph.")
    # Matplotlib commands:
    plt.title(f"{source} Eye Diagram")
    plt.ylabel("Voltage")
    plt.xlabel("Time")
    # For grid that is 10 divisions wide and 8 divisions tall.
    plt.grid(visible=True, color="gray", linewidth=0.33, linestyle="-")
    # Columns go from 0 to datasize["columns"]-1.
    xtick_locations = np.linspace(0, datasize["columns"] - 1, 11, dtype=int)
    plt.xticks(
        xtick_locations,
        [labels["xmin"], "", "", "", "", "", "", "", "", "", labels["xmax"]],
    )
    # Rows go from datasize["rows"]-1 to 0.
    ytick_locations = np.linspace(datasize["rows"] - 1, 0, 9, dtype=int)
    plt.yticks(
        ytick_locations, [labels["ymin"], "", "", "", "", "", "", "", labels["ymax"]]
    )
    plt.imshow(bin_data.T, cmap="hot")
    plt.colorbar()
    svg_filename = f"{local_base_directory}{base_file_name}_{source}.svg"
    plt.savefig(svg_filename)
    plt.show()
    plt.clf()  # Clear the current figure.
    print(f"Color grade data written to {svg_filename}.")


def get_binary_eye_data():
    """Returns the data points for an eye diagram by
    transferring binary data to computer.
    """

    print("Getting eye waveform data.")

    # Waveform data set up.
    Infiniium.write(":SYSTem:BORDer LENDian")

    # Get the number of waveform points.
    wfmpts = int(Infiniium.query(":WAVeform:CGRade:POINts?"))
    print(f"    Points in eye waveform: {wfmpts}")

    # Get eye waveform data.
    message = ":WAVeform:CGRade:INTeger:DATA?"
    uint32_values = Infiniium.query_binary_values(message, datatype="L", container=list)

    # Get the number of data values.
    num_of_uint32_values = len(uint32_values)
    print(f"    Number of eye waveform data values: {num_of_uint32_values}")

    return uint32_values


def get_eye_info(source):
    """Returns information about eye diagram."""

    eng_s = EngFormatter(unit="s", places=1, sep=" ")
    eng_V = EngFormatter(unit="V", places=1, sep=" ")

    datasize = {}
    labels = {}

    print("Information on real-time eye:")
    Infiniium.write(f":WAVeform:SOURce {source}")

    # Number of data rows and columns.
    datasize["columns"] = int(Infiniium.query(":WAVeform:CGRade:COLumns?"))
    print(f"    Number of Columns: {datasize["columns"]}")

    datasize["rows"] = int(Infiniium.query(":WAVeform:CGRade:ROWS?"))
    print(f"    Number of Rows: {datasize["rows"]}")

    # Xmin label on graph.
    xmin = float(Infiniium.query(":WAVeform:CGRade:XORigin?"))
    labels["xmin"] = eng_s(xmin)
    print(f"    X origin: {labels["xmin"]}")

    # Ymin label on graph.
    ymin = float(Infiniium.query(":WAVeform:CGRade:YORigin?"))
    labels["ymin"] = eng_V(ymin)
    print(f"    Y origin: {labels["ymin"]}")

    # Time spacing is delta time between columns.
    timespacing = float(Infiniium.query(":WAVeform:CGRade:XINCrement?"))
    print(f"    Time Spacing: {eng_s(timespacing)}")

    # Row spacing is delta amplitude between rows.
    rowspacing = float(Infiniium.query(":WAVeform:CGRade:YINCrement?"))
    print(f"    Row Spacing: {eng_V(rowspacing)}")

    # Calculate x and y max labels on graph.
    xmax = xmin + (timespacing * datasize["columns"])
    labels["xmax"] = eng_s(xmax)

    ymax = ymin + (rowspacing * datasize["rows"])
    labels["ymax"] = eng_V(ymax)

    return datasize, labels


def exit_program():
    """Exit program."""

    # Close connection to oscilloscope.
    sys.stdout.write("Closing oscilloscope connection.\n")
    Infiniium.write(":SYSTem:GTLocal")  # Unlock GUI.
    Infiniium.clear()  # Clear oscilloscope communications interface.
    Infiniium.close()  # Close communications interface to oscilloscope.
    rm.close()  # Close resource manager.
    print("End of program.")
    sys.exit()


def check_error_queue(when):
    """Check error queue."""

    errors_found = False
    while True:
        # Keep reading errors until "No error".
        error_string = Infiniium.query(":SYSTem:ERRor:NEXT? DIAGnostic")
        if error_string:  # If there is an error string value.

            if error_string.find("0,", 0, 2) == -1:  # Not "No error".
                errors_found = True
                print(f"ERROR: {error_string}")

            else:  # "No error"
                break

        else:  # :SYSTem:ERRor:NEXT? DIAGnostic should always return string.
            errors_found = True
            print("ERROR: :SYSTem:ERRor:NEXT? DIAGnostic returned nothing.")
            break

    if errors_found:
        print(f"Exited because error(s) found when: '{when}'")
        exit_program()


# ==========================================================
# Main program:
# ==========================================================

# Connect and initialize oscilloscope.
rm = pyvisa.ResourceManager("C:\\Windows\\System32\\visa64.dll")
try:
    Infiniium = rm.open_resource(oscilloscope_visa_address)
except Exception:
    print(
        f"Unable to connect to oscilloscope at {oscilloscope_visa_address}. Aborting program."
    )
    sys.exit()

Infiniium.timeout = timeout  # Set global timeout.
Infiniium.clear()  # Clear the instrument bus.
# Lock GUI happens automatically.

# Default Setup.
print("Default Setup.")
Infiniium.write(":SYSTem:DEFault")

# # Use auto-scale to automatically set up oscilloscope.
# print("Autoscale.")
# Infiniium.query(":SYSTem:AUToscale;*OPC?")

# Stop acquisitions and clear the display.
Infiniium.write(":ACQuire:STOP")
Infiniium.write(":ACQuire:CDISplay")  # Clear display.

# Turn on CHANnel1 real-time eye.
source = "CHANnel1"
eye_source = "ECHannel1"
Infiniium.query(f":{source}:EYE:DISPlay ON;*OPC?")

# Make 100 acquisitions.
Infiniium.write(":LTESt:ACQuire:CTYPe:WAVeforms 100")
Infiniium.write(":LTESt:ACQuire:STATe ON")
Infiniium.query(":ACQuire:RUN;*OPC?")  # *OPC? required when limit testing.
Infiniium.write(":LTESt:ACQuire:STATe OFF")

# Get real-time eye information.
datasize, labels = get_eye_info(eye_source)

# Get real-time eye data.
uint32_values = get_binary_eye_data()
bin_data = np.array(uint32_values, dtype=np.uint32)
bin_data = np.reshape(bin_data, (datasize["columns"], datasize["rows"]))

# Plot real-time eye data received.
draw_graph(bin_data, datasize, labels, eye_source)

# Check error queue.
check_error_queue("End of program")

# Exit program.
exit_program()