Grid
Vertical Divisions
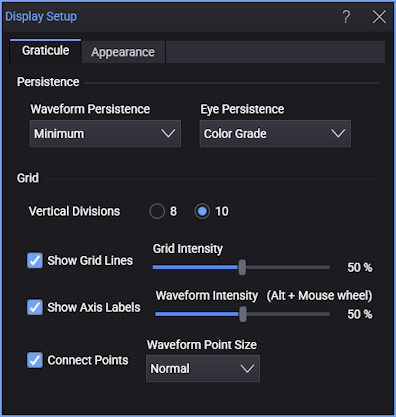
You can specify that grids have eight or 10 vertical divisions. Changing the number of vertical divisions does not affect the vertical range being displayed. Only the number of divisions used to display the vertical range is changed.
Grid Intensity
You can change the appearance of the grid lines on the display graticule.
Click Show Grid Lines to turn the grid on and off. The outer edges of the display graticule will remain visible. The default condition is on.
Click Show Axis Labels to turn vertical and horizontal grid line value labels on and off.
Composed units can result for math function waveforms. For example:
- Amp * Second = Coulomb (C)
- Ohm * Second = Henry (H)
- Coulomb / Volt = Farad (F)
- Volt / Amp = Ohm (Ω)
- Volt * Amp = Watt (W)
- Watt * Second = Joule (J)
Operations on composed units can also restore to base units if appropriate. For example, a Differentiate (resulting in <unit>/second) of a Joule waveform will have Watt units.
If the grid is turned on, the Grid Intensity can be adjusted. You can adjust the intensity between the values of 0% (no brightness) to 100% (full brightness). The default value is 50%.
The Waveform Intensity can be adjusted. You can adjust the waveform intensity between the values of 0% (minimal waveform brightness) to 100% (full waveform brightness). The default value is 50%. You can adjust the intensity of displayed waveforms to account for various signal characteristics, such as fast time/div settings and low trigger rates. Increasing the waveform intensity lets you see the maximum amount of noise and infrequently occurring events. Reducing the intensity can expose more detail in complex signals. You can also adjust waveform intensity (without opening this dialog box) using Alt+Mouse Wheel.
Connect Points
The Connect Points fields are available with Persistence set to Minimum, Infinite, or Variable. When Connect Points is enabled, lines are displayed to connect the consecutive data points on the display. This lets you view what the waveform actually looks like.