Persistence
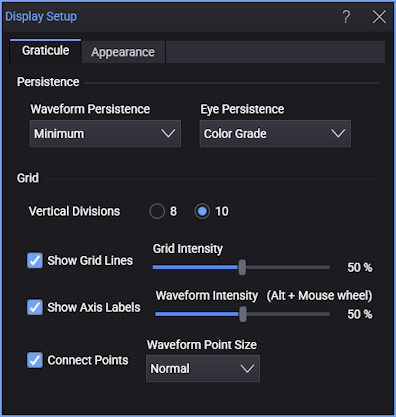
Waveform Persistence
Persistence determines how long a data point is kept on the display before being erased from the display graticule. Persistence is a display memory function, therefore acquired waveforms are written only to display memory. Acquisition memory is where the current waveform data is stored. Therefore, only the last acquired waveform is held in acquisition memory. Display memory is what is seen on the display graticule. The persistence control allows you to view the extremes of a waveform's variation, such as the occurrence of jitter. Setting the persistence to the minimum amount of time allows for easiest viewing of variations in the acquired waveforms. Setting the persistence to the maximum amount of time (infinite) allows for a complete view of everything measured in the waveform.
-
Minimum — sets the display time of each waveform data point to the minimum of 40 ms or one trigger cycle. You can use the minimum persistence mode to view the fastest display update rate. When the waveform acquisition is stopped, the last acquired data points are left on the display.
-
Infinite — displays the sampled data points for an endless period of time. As sample points are acquired, the luminosity of the sample points changes in intensity. Newly acquired sample points are shown at full intensity while previously acquired points are displayed at half intensity. You can use this mode to measure the worst-case characterization of signal noise, jitter, signal drift, timing, and find infrequent events. In infinite persistence mode, all sampled data points are left on the display until one of the following is adjusted or executed: Clear Display, Auto Scale, Default Setup, operating mode changed, mask testing, vertical or horizontal settings, trigger settings, display source state (on or off), or acquisition settings.
-
Gray Scale and Color Grade modes — these options also provide infinite persistence. In this case, overlaid waveform data is saved in a database that records "pixel" hits where waveforms cross small boxes of vertical range and time range. Overlaid waveform databases are displayed so that pixels with a higher numbers of hits use more "intense" colors.
Each time a specific display sample point is acquired (time and amplitude coordinate), a counter for that coordinate is incremented. The maximum count for each counter is 232. To display the data, coordinate counts are divided into density ranges.
In Gray Scale mode, density ranges are represented by shades of the same color (one hue with variations in saturation and luminosity).
In Color Grade mode, density ranges are represented by separate colors.
Both modes display sampled data points for an endless period of time. The peak density of data counts is represented by the brightest regions of the waveform. If these persistence modes are left on for a long time, the waveform becomes saturated with the color of highest hits.
To change the colors used to present Color Grade or Gray Scale persistence waveforms, click the Appearance tab.
-
Variable — lets you define the Persistence Time of the input waveform. Newly acquired sample points are displayed at full intensity (brightest) while the intensity of previously acquired sample points fade to black during the defined persistence time. You can use this mode to view infrequent events and rapidly changing waveforms. You can set the time a waveform sample point is displayed from 100 ms to 40s, with one digit resolution. The default setting is 300 ms. If one of the following is changed, the displayed waveform is redrawn and any accumulated waveforms are cleared: the vertical or horizontal scaling, the vertical or horizontal position, the offset, the trigger source or level, a clear display is executed, or an Auto Scale is executed.
Persistence versus Resolution Persistence Time in Seconds Resolution (Step Size) 0.1 - 0.9 0.1s steps 1 - 10 1s steps 10 - 40 10s steps
Waveform persistence applies only in the display graticule area.
If you are adjusting the amplitude or frequency of a signal source, you may find that more persistence (variable, infinite, color grade or gray scale) is useful for observing long-term changes in a signal or observing signals with low repetition rates. If you are adjusting signal parameters, such as scale or delay, you will find that minimum persistence is useful due to the fast update rate.
Eye Persistence
Real-time eye diagrams have infinite persistence. Eye diagrams are produced by overlaying (sometimes called folding) UIs (unit intervals) of waveform data about recovered clock edges. Overlaid data is saved in a database that records "pixel" hits where waveforms cross small boxes of vertical range and time range. Overlaid waveform databases are displayed so that pixels with a higher numbers of hits use more "intense" colors. The choices for displaying real-time eye persistence are:
-
Color Grade — A range of colors are used to represent the number of pixel hits in the overlaid waveform database. You can choose from several color grade themes in the Appearance tab.
-
Gray Scale — Different brightness levels of the waveform color or gray are used to represent the number of pixel hits in the overlaid waveform database. You can choose whether the waveform color or gray is used in the Appearance tab.