Measurement Trend Operators

 The Measurement Trend operators let you plot measured values with respect to the signal(s) that the measurement is being made on.
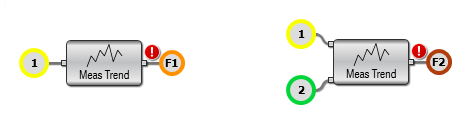
The first Measurement Trend operator takes one input waveform (Channel, Memory, Common Mode, etc.) and a measurement being made on that waveform, and it outputs one Measurement Trend function waveform.
The second Measurement Trend operator takes two input waveforms and a measurement being made on those two waveforms, and it outputs one Measurement Trend function waveform.
To plot a measurement trend, the measurement must use all edges in an acquisition, whether that is by design or due to the Measure All option being selected.
To set up a Measurement Trend function:
- Open the Math palette.
-
From the User/Custom operators group, drag one of the Meas Trend operators onto the palette.
If the measurement whose trend you want to display operates on one input waveform, drag the single-input Meas Trend operator onto the palette.
If the measurement whose trend you want to display operates on two input waveforms, drag the two-input Meas Trend operator onto the palette.
- Drag to the Meas Trend operator input(s) the waveform(s) on which the measurement is being (or will be) made.
- Drag one of the function colors to the Meas Trend operator's function output.
- Click the Meas Trend operator to open the Measurement Trend Setup dialog box.
- In the Operator Setup tab, select the measurement whose values are to be plotted.
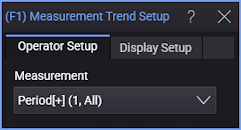
Listed only are measurements using all edges whose inputs match the inputs selected for the Meas Trend operator. You can also select "None" which effectively disables the measurement trend function.
- In the Display Setup tab, you can specify the math function's vertical and horizontal scaling.
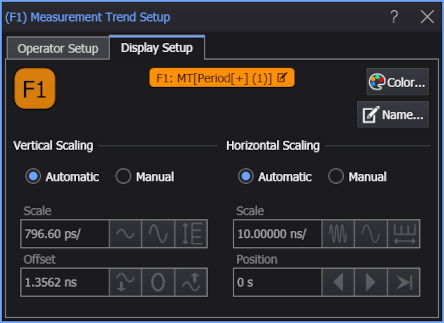
For measurement trend function waveform scaling, a one-time tracking of the source waveform (for the X axis) and measurement (for the Y axis) can be performed. This can happen when an auto-scale is performed or when changes to the analysis occur.
- Close the dialog box and hide the Math palette.
The Measurement Trend waveform appears in the Waveform window.
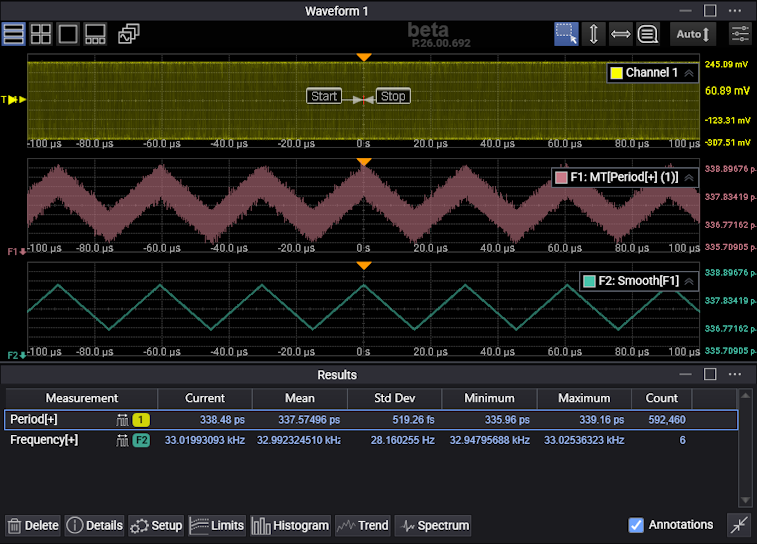
The Measurement Trend waveform's horizontal X axis units are the same as the input waveform while the Y axis units are the same as the measured values (for example, seconds for period measurements, Hz for frequency measurements, and % for duty cycle measurements).
At least two measurements must be made per acquisition to be able to plot a trend.
Up to 64 measurement trend functions can be on at once.
With function trend waveforms, you can perform measurements and apply other math functions to the waveform just like you can with other waveforms.
In Infiniium 2026, measurement trend waveform data points are connected with lines. In earlier generation Infiniium real-time oscilloscope software, data points are drawn as flat lines whose levels change with each measurement data point.