Composite DDJ Histogram
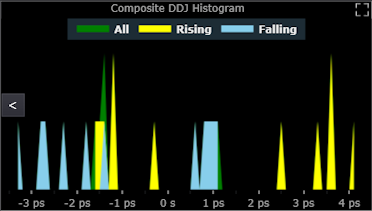
The Composite Data-Dependent Jitter (DDJ) Histogram shows three histograms of correlated jitter based on data from all edges, rising edges, and falling edges. The peak-to-peak spread of the all-edges histogram represents the DDJ. The peak-to-peak spread of the rising-edges histogram or the falling-edges histogram, whichever is greater, represents Data-Dependent Interference (DDI). DDI is the same as ISI (Inter-Symbol Interference). The difference between the mean of the rising edge positions and the mean of the falling edge positions represents the Duty Cycle Distortion (DCD). The graph's horizontal axis indicates negative (-) time for samples that occur earlier than expected and positive (+) time for samples that occur later than expected.