Composite TJ Histogram
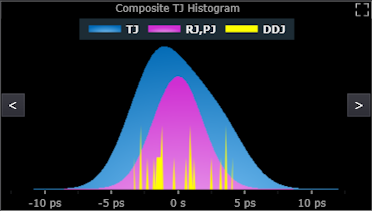
The Composite TJ Histogram shows separate graphs of Total Jitter (TJ), Data-Dependent Jitter (DDJ), and the combined histogram of uncorrelated Random Jitter (RJ) and uncorrelated Periodic Jitter (PJ). The graph’s horizontal axis indicates negative (-) time for samples that occur earlier than expected and positive (+) time for samples that occur later than expected.