Jitter Bathtub
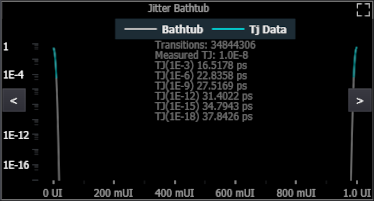
The Jitter Bathtub graph plots the width of the data valid window of a serial data signal (horizontal axis) versus bit error rate (vertical axis). The dark portion of the traces represent TJ values that can be measured directly from the acquired TIE data. The light portion of the traces represent TJ values that are extrapolated using the calculated values of RJ and DJ.