RJ/PJ Histogram
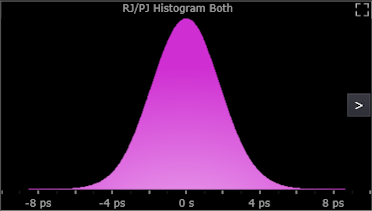
The RJ/PJ Histogram shows the histogram of all uncorrelated jitter. The graph's horizontal axis indicates negative (-) time for samples that occur earlier than expected and positive (+) time for samples that occur later than expected.