RJ,PJ Spectrum
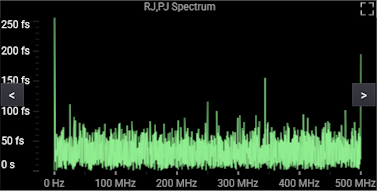
The RJ,PJ (Random Jitter, Periodic Jitter) Spectrum graph shows the discrete Fourier transform of the combined RJ and PJ. The vertical axis represents the magnitude of each spectral jitter component and the horizontal axis identifies the frequency. The displayed magnitude spectrum is calculated independently for each acquired waveform and then averaged with magnitude spectrums from previous trigger cycles.
The frequency resolution of the RJ,PJ Spectrum is improved by increasing the acquisition record length. However, increasing the acquisition record length can significantly affect calculation time. Overall calculation time can be improved by not displaying the RJ,PJ Spectrum graph.
For clock-type signals, the discrete Fourier transform is calculated from the uniformly spaced RJ,PJ time record, where each value in the RJ,PJ time record corresponds to a voltage transition in the clock-type waveform. For NRZ data-type signals, the RJ,PJ time record is not comprised of uniformly spaced jitter values. For these signals, the RJ,PJ time record contains "holes" caused by consecutive logical ones or zeros. The lack of information about the jitter at times corresponding to these holes makes it impossible to determine the true RJ,PJ spectrum. The spectrum is calculated as if the holes were all set to a value of zero, and the resulting spectrum appears to be modulated (convolved in the frequency domain) by the data pattern.