TJ Histogram
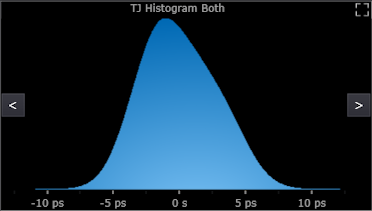
The TJ (Total Jitter) Histogram shows the combined Random Jitter (RJ), Periodic Jitter (PJ) and Data Dependent Jitter (DDJ) probability density functions. The TJ histogram is calculated by cross-correlating (similar to convolving without the "flip") the RJ,PJ histogram with the DDJ histogram. It is a histogram of all of the measured jitter, both correlated to the data pattern and uncorrelated to the data pattern, combined in a single histogram. The graph's horizontal axis indicates negative (-) time for samples that occur earlier than expected and positive (+) time for samples that occur later than expected.