Noise Spectrum
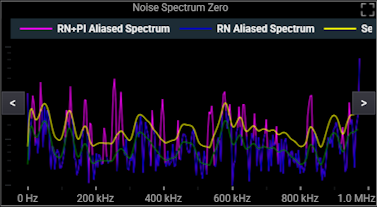
The Noise Spectrum graph shows how RN (Random Noise) and PI (Periodic Interference) are separated. It provides additional insights into the noise measurements. It is a qualitative tool only; the noise spectrum is aliased and the vertical axis is not labeled.
Because the signal is under-sampled, all periodic components are aliased down below 20 kHz. The RN (Random Noise) is calculated as the area of the power spectral density excluding any peaks in the spectrum (for example, the baseline noise of the power spectral density).
The graph displays the Aliased Noise Spectrum results for either one or zero levels but not both levels.