Viewing the Phase Noise Analysis Results
After you set up phase noise analysis, the Phase Noise On check box in the Phase Noise Setup dialog box is selected to show the feature is enabled.
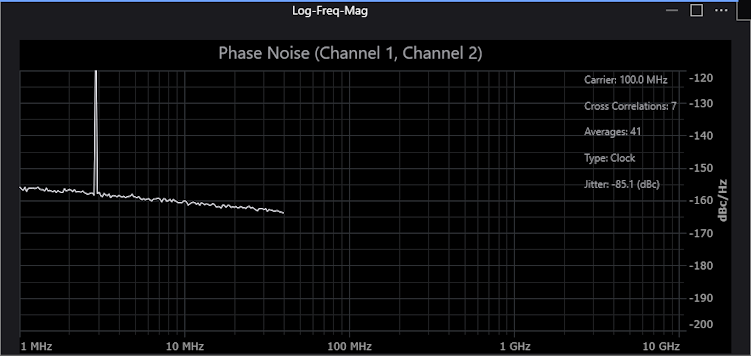
The default Spur Processing selection is Normalized (dBc/Hz), but you can also, according to the Spur Sensibility setting, Omit spurs or show a better representation of the energy at the spurs using the Power (dBc) setting.
If your clock source uses spread-spectrum clocking (SSC), you can select the Remove SSC check box to remove the most significant SSC spurs from the phase noise analysis results.

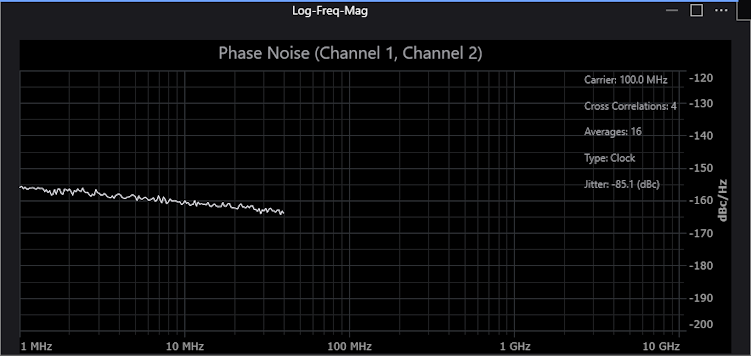
The phase noise analysis results are presented in a log frequency plot where the amplitude units are dBc/Hz (decibels relative to the carrier power normalized to a 1 Hz bandwidth). The X-axis is the frequency offset from the nominal signal or "carrier" frequency.
What Affects the Phase Noise Analysis Limit?
When the bandpass filter is used, the phase noise analysis stops at about 40% of the carrier frequency.
If the bandpass filter is not used and one edge direction is measured, the phase noise analysis stops at about 50% of the carrier frequency.
If the bandpass filter is not used and both edge directions are measured, the phase noise analysis stops at about 100% of the carrier frequency.
The default bandwidth setting for the bandpass filter is equal to the carrier frequency.