Other topics about Analysis and Processing of Result
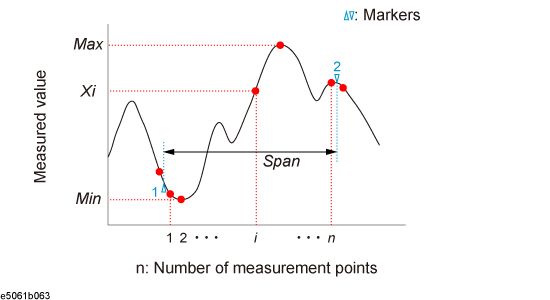
You can easily determine the statistics data for a trace (span, mean, standard deviation, and peak-to-peak). The definitions for the statistics data elements are shown below. It is calculated within the range of markers 1 and 2. The markers 1 and 2 are activated automatically.
|
Statistics data element |
Definition |
|
Span |
Span between markers 1 and 2. |
|
Mean (mean) |
(n: number of points between markers 1 and 2; xi: measured value at the i-th measurement point between markers 1 and 2.) |
|
Standard deviation (s. dev) |
(n: number of points between markers 1 and 2; xi: measured value at the i-th measurement point between markers 1 and 2; mean: Mean) |
|
Peak-to-peak (p - p) |
Max - Min (Max: greatest measured value between markers 1 and 2.; Min: smallest measured value between markers 1 and 2.) |
Press Channel Next (or Channel Prev) and Trace Next (or Trace Prev) to activate the trace of which the statistical data is required.
Press Marker Fctn > Statistics to turn ON the display of statistics data.
The markers 1 and 2 are activated automatically. Move markers 1 and 2 to the position of the measurement.