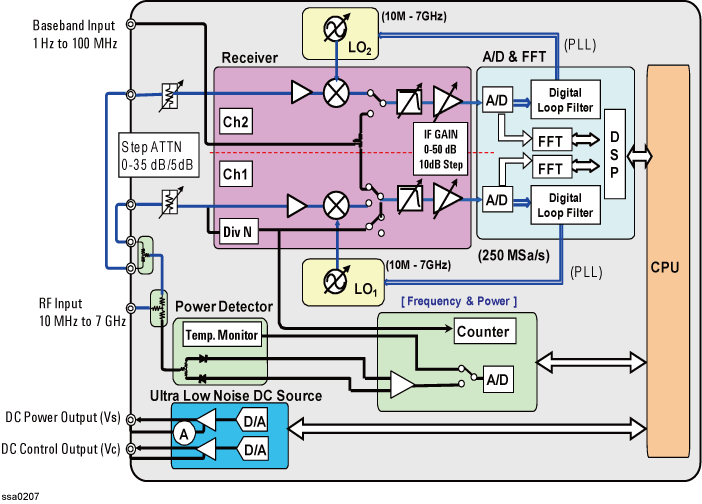
The E5052B consists of a DC source, a frequency counter, a power meter, two receivers (down converters and A/D & FFT), two local synthesizers and a digital control (CPU) section as shown in the following figure.
E5052B simplified block diagram

The DC source generates a dc power voltage and a dc control voltage for the DUT. The DC source section also monitors the current of the DC Power output.
The test signal from the DUT flows into the RF IN port. The signal is divided into two signals. One goes to the meter section. The other goes to the receivers section. The power meter section measures the RF input power level for RF power measurement.
The receiver section has two receivers. Each receiver converts the incoming signal into IF signals (or baseband signals) using the local synthesizer, and then digital data for each measurement function. The digital output data of the receiver section is transferred to the digital control section. One receiver also transmits the incoming signal to the frequency counter section. The frequency counter section measures the frequency of the signal.
The digital section controls the analog measurement section as well as calculates the measurement items (parameters) of the DUT from the digital output data of the receivers. The calculated results are transferred to the display section and visualized by means of the color LCD.
The E5052B has two phase noise measurement modes, a normal capture range and a wide capture range, and a cross correlation technique with two independent measurement channels is available for both modes.
The normal capture range takes a PLL (direct homodyne) method show in the following figure.
The PLL (direct homodyne) method for PN (Normal)
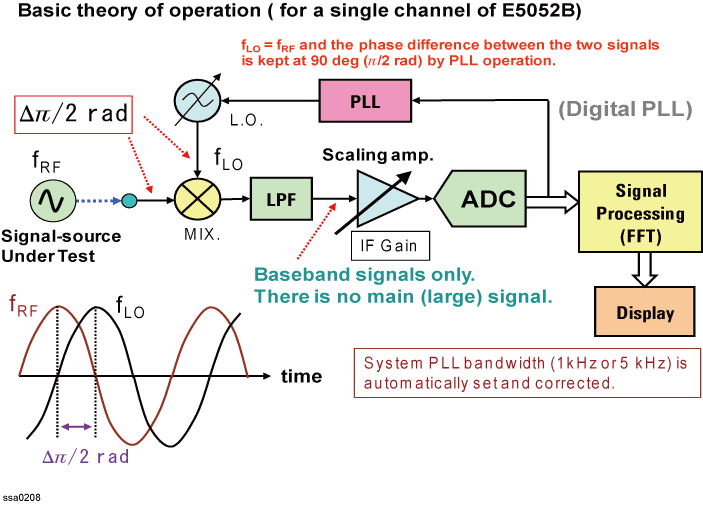
With a PLL method, local oscillator’s frequency (fLO) is always same as a frequency (fRF) of signal source under test and the phase difference between the two signals (fLO and fRF) is kept at 90 degree (pi/2 radian) by Digital PLL (Phase Locked Loop) operation. Then, an output of LPF is baseband signals only, there is no main (large) signal. The baseband signals converted into digital data are calculated measured by FFT. For very quiet signal sources, exceptionally stable local reference oscillators, the normal capture range mode can satisfy any requirements of ultra-low phase noise or jitter measurement.
The E5052B has two phase noise measurement modes, a normal capture range and a wide capture range, and a cross correlation technique with two independent measurement channels is available for both modes.
The wide capture range takes a heterodyne (digital) discriminator method shown in the following figure.
The Heterodyne (digital) discriminator method for PN (wide) and AM noise measurements
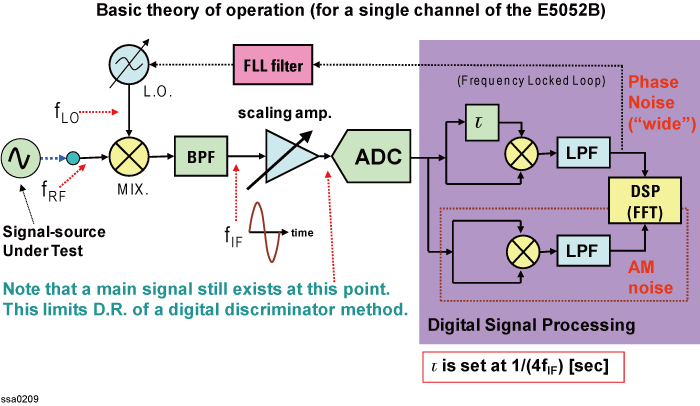
The RF signal of Signal source under test is converted into an IF signal (fIF), then the IF signal leveled properly by the scaling amplifier goes to ADC. The frequency of the IF signal is kept by a FLL (Frequency Locked Loop). In Phase Noise (wide) of purple zoom, Digital Signal Processing separates the captured IF signal by ADC to V1(t) (signal input to mixer directly) and V2(t) (signal delayed in tau). And set delay time (tau) to get the phase difference at 90 degree between V1(t) and V2(t) into the mixer. The delay time is set at 1/(4fIF). After the LPF, digital signal processing provides the low frequency baseband components of the product of V1(t) and V2(t). The baseband components are calculated by the FFT. For noisy signal sources or drifty oscillators, the wide capture range mode provides reasonable measurement uncertainty and dynamic range in case the normal capture range mode does not work well.
The heterodyne (digital) discriminator method also provides very easy and accurate AM noise measurements (by setting the delay time zero) with the same setup and RF port connection as phase noise measurement.
The cross correlation technique for noise floor reduction is used widely in the E5052B. The basic theory of operation for cross-correlation calculation is traditionally well-known as shown in the following figure. The E5052B implemented this principle by a highly sophisticated manner and enabled its real time operation on display.
Two-channel cross correlation technique
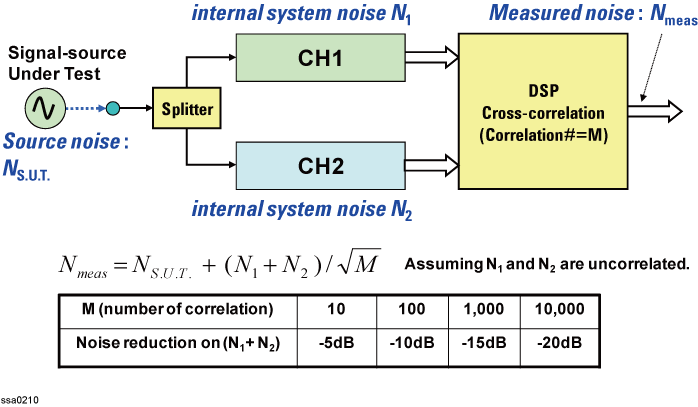
The cross correlation technique uses two signal-channel measurement systems. Only the coherent noise present in both channels will average to a finite value. The time average of the incoherent noise will approach zero as M-1/2, where M is the number of average. The measured phase noise of the system is represented as the equation shown in the figure.
The diagram in the effect of Cross Correlation is show in the following figure.
Cross-Correlation effect
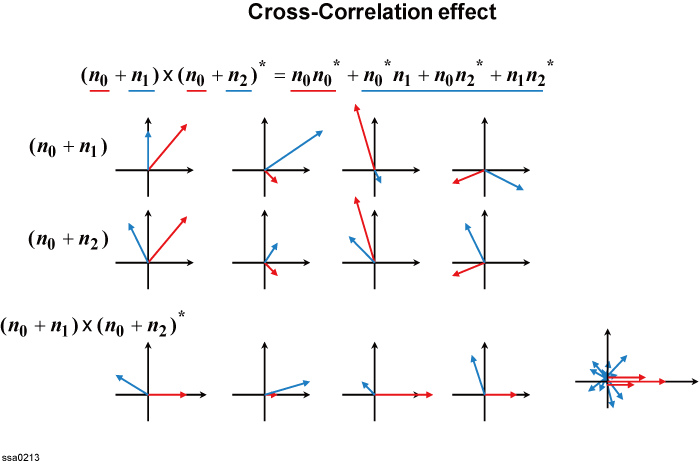
The expression (n0+n1) means the noise (source noise n0 and internal system noise n1) of the channel 1. The expression (n0+n2) means the noise (source noise n0 and internal system noise n2) of the channel 2. The mark "*" means complex conjugate and all noise parameters are random complex variables. The red arrows show noise phasors of the source noise. The blue arrows show internal noise phasors and assuming n1 and n2 are uncorrelated. After summing up all noise phasors, the internal noise phasors cancel out each other and only the source noise phasors remain.
The E5052B has two independent measurement channels for its transient measurement as shown in the following figure. Each channel takes a different method for measuring a signal’s frequency simultaneously.
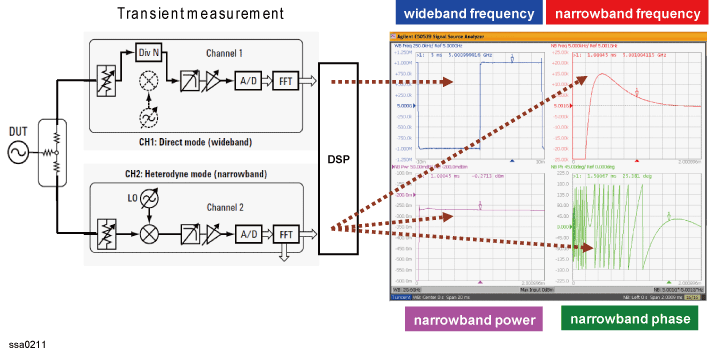
Direct mode (wide band) contains a frequency divider to translate the frequency of signal source under test into a lower frequency, and then it directs to ADC for signal sampling.
In Heterodyne mode (narrow band), the RF signal of the signal source under test is converted into an IF signal and then the IF signal goes to ADC. Both wide band and narrow band modes operate completely in parallel, the E5052B enables observation of the entire picture of frequency changes and detailed transient response in frequency/phase/power at the same time.
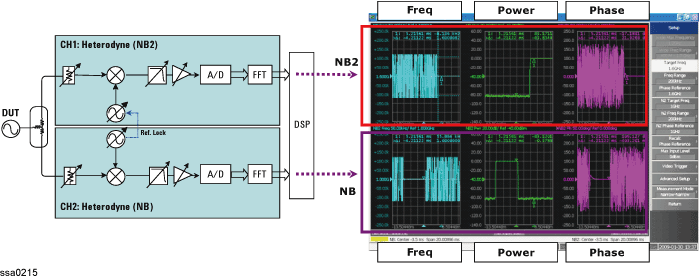
Each channel works in Heterodyne mode as shown in the figure above. The frequency range in both channels can be set as identical or differently. Two LOs have the same time base as one is locked to another. Both channels operate completely in parallel.
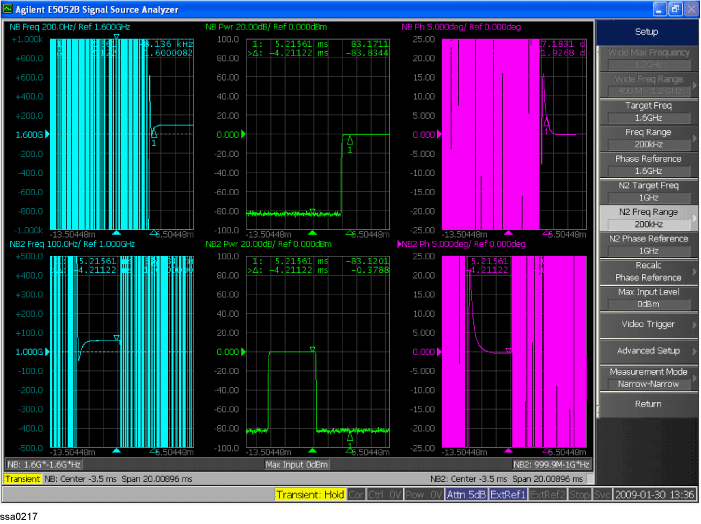
The figure is an example of 600 MHz frequency jump (It hops from 1 GHz to 1.6 GHz in a few milliseconds) measurement using Narrow-Narrow band mode. (See bellow)
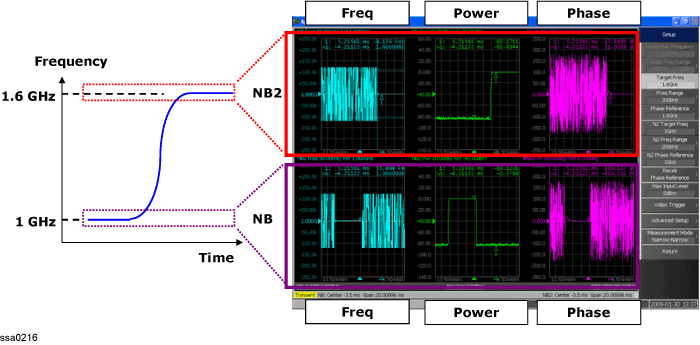
Unlike the Wide-Narrow band mode, detailed transient response at the start as well as the stop frequency can be observed. (See bellow)
Zooming traces for the analysis of detailed transient response at start and stop frequency
