This provides windows for displaying traces. Because a measurement corresponds to a window, it is called a measurement window. When the outer frame of a measurement window is displayed in light gray, the measurement is active (the measurement for which setup is being performed). In Measurement Window spectrum window is active. To make a measurement active, use Window Next . Clicking inside a measurement window will also make it active. The following figure shows example of a spectrum measurement displayed in maximum screen by using Window Max.
Measurement Window
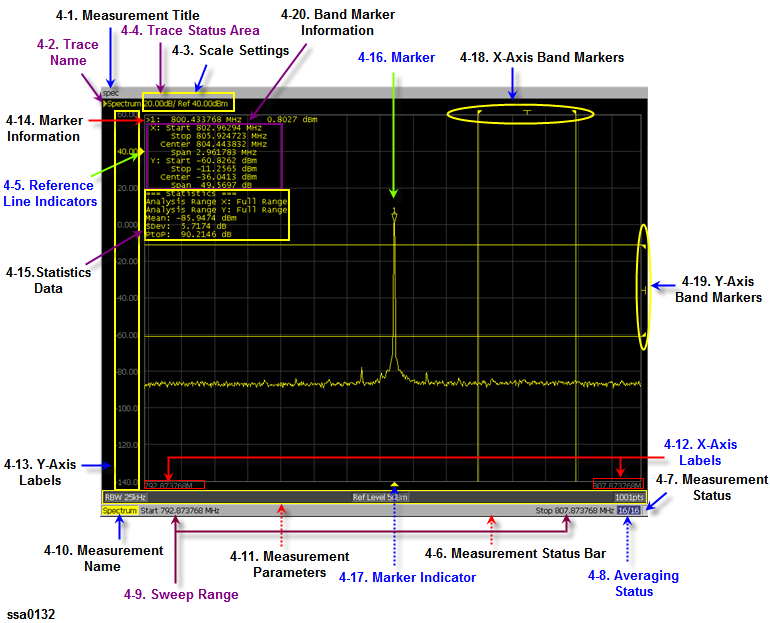
You can assign a title to each channel and have the title displayed in the bar. To set up the measurement title, enter a title in Display > Edit Title Label and then toggle on/off the title display by using Display > Title Label .
The names of the traces on the measurement are displayed here.![]() to the left of the trace name indicates the active trace (the trace for which setup is being performed). To switch over the active trace, use Trace Next. Clicking the graph of the trace will also activate the trace.
to the left of the trace name indicates the active trace (the trace for which setup is being performed). To switch over the active trace, use Trace Next. Clicking the graph of the trace will also activate the trace.
The scale setting for each trace is displayed here. This example shows that “0.00dB/” corresponds to 10 dB per division. “Ref -50.00.000dB” shows that the value of the reference line is -50 dB. To specify the scale settings, use each softkey that can be displayed by pressing the Scale hardkey.
The setup for each trace is displayed here.
Trace Status Display
|
Classification |
Contents inside the [ ] |
Meaning |
|
Turning on/off traces |
Nothing |
Data trace: ON, Memory trace: OFF |
|
M |
Data trace: OFF, Memory trace: ON |
|
|
D&M |
Data trace: ON, Memory trace: ON |
|
|
off |
Data trace: OFF, Memory trace: OFF |
|
|
Performing data math: Refer to the indication in parentheses when the memory trace is turned on. |
D+M (D+M&M) |
Execution of Data+Mem math |
|
D−M (D-M&M) |
Execution of Data−Mem math |
|
|
D*M (D*M&M) |
Execution of Data*Mem math |
|
|
D/M (D/M&M) |
Execution of Data/Mem math |
|
|
Smoothing |
Smo |
Smoothing: ON |
These indicate the position of the reference line for the Y-axis scale in the rectangular display format. There is an indicator to the right of the scale (![]() ). To enter a numeric value for the position of the reference line, open the data entry bar using the keys Scale > Reference Position. You can also move the position of the reference line by placing the mouse pointer on the reference line indicator (the pointer changes from
). To enter a numeric value for the position of the reference line, open the data entry bar using the keys Scale > Reference Position. You can also move the position of the reference line by placing the mouse pointer on the reference line indicator (the pointer changes from ![]() to
to ![]() . ), moving the indicator vertically with the left mouse button kept pressed, and then releasing the button at the desired location (i.e., a drag-and-drop operation).
. ), moving the indicator vertically with the left mouse button kept pressed, and then releasing the button at the desired location (i.e., a drag-and-drop operation).
The status of each measurement is displayed here.
Displays the update status of traces on the measurement.
|
Status |
Description |
|
# |
Invalid traces. The measurement conditions have changed, but the traces on the measurement window currently displayed have not been updated to match the new conditions. |
|
(not displayed) |
Valid traces. |
Displays the averaging factor and averaging count when averaging is turned on.
|
Status |
Description |
|
n/m (displayed in blue) |
Averaging : ON (m: averaging factor; n: averaging count) |
|
(not displayed) |
Averaging: OFF |
Indicates the sweep range by using the start/stop or center/span. This varies depending on the given parameters or measurements.
Indicates the measurement name.
Indicates the parameters specified to perform a measurement sweep at the bottom of each measurement screen. The content may vary depending on the measurement.
X-axis divisions in the rectangular display format. To hide the divisions, select "OFF" in -Y # of Digits. (The display/nondisplay of the X-axis divisions interlocks with that of the Y-axis divisions.)
Y-axis divisions in the rectangular display format. The value of the reference line (the division line indicated by ![]() ) can be entered numerically by opening the data entry bar using the keys: Scale > Reference Value. You can change values of the reference line in one division intervals by placing the mouse pointer in the area of the graticule label (the pointer changes from
) can be entered numerically by opening the data entry bar using the keys: Scale > Reference Value. You can change values of the reference line in one division intervals by placing the mouse pointer in the area of the graticule label (the pointer changes from![]() to
to ![]() ), moving the pointer vertically with the left mouse button pressed, and then releasing the button at the desired location. By using Display > Y # of Digits, you can select the display format of the graticule label from three options: 4 digits, 12digits, and “not displayed.”
), moving the pointer vertically with the left mouse button pressed, and then releasing the button at the desired location. By using Display > Y # of Digits, you can select the display format of the graticule label from three options: 4 digits, 12digits, and “not displayed.”
The marker information is displayed in a list. It shows the marker number, marker x-axis value, and marker measurement value from left to right. For the active marker (the one for which setup and analysis are being performed), > is displayed to the left of the marker number. For the reference marker,Δ is displayed instead of the marker number.
Turning on the statistics data function displays statistics data here. For more about the statistics data function, see Determining Mean, Standard Deviation, and Peak-to-Peak of the Trace
The markers used for reading values on a trace. Up to six markers can be displayed for each trace.
|
Status |
Description |
|
|
Active marker (ready for setup and analysis) |
|
|
Non-active marker |
Here, n denotes a marker number. For the reference marker, however, nothing is displayed at the location of n. Clicking the marker or one of the Marker Indicators makes the marker active.
These indicate the positions of markers on the x-axis.
|
Status |
Description |
|
|
Active marker indicator |
|
Δ |
Non-active marker indicator |
You can also move a marker to desired position by placing the mouse pointer on marker indicator or the position of the marker itself (the pointer changes from![]() to
to ![]() ),moving the indicator vertically with the left mouse button pressed, and then releasing the button at the desired location.
),moving the indicator vertically with the left mouse button pressed, and then releasing the button at the desired location.
By turning on the x-axis band marker function, the x-axis band marker is displayed in a specified position.
|
Status |
Description |
|
|
Indicator of start value of x-axis band marker |
|
|
Indicator of stop value of x-axis band marker |
|
|
Indicator of center value of x-axis band marker |
You can also move a marker to the desired position by placing the mouse pointer on the marker indicator or the position of the marker itself (the pointer changes from![]() to
to ![]() ),moving the indicator vertically with the left mouse button pressed, and then releasing the button at the desired location.
),moving the indicator vertically with the left mouse button pressed, and then releasing the button at the desired location.
By turning on the y-axis band marker function, the y-axis band marker is displayed in a specified position
|
Status |
Description |
|
|
Indicator of start value of y-axis band marker |
|
|
Indicator of stop value of y-axis band marker |
|
|
Indicator of center value of y-axis band marker |
You can also move a marker to the desired position by placing the mouse pointer on the marker indicator or the position of the marker itself (the pointer changes from ![]() to
to ![]() ), moving the indicator up or down with the left mouse button pressed, and then releasing the button at the desired location.
), moving the indicator up or down with the left mouse button pressed, and then releasing the button at the desired location.
Turning on the x-axis or y-axis band marker function will display the corresponding band marker information on a list in the order of start, stop, center and span.