Other topics about Data Analysis
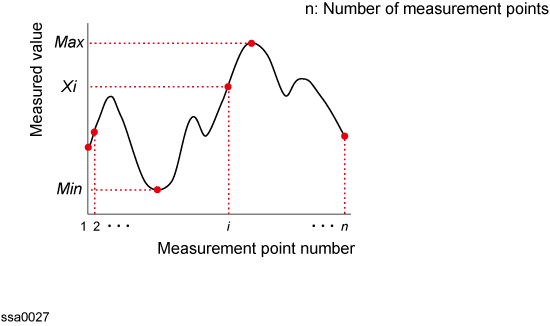
You can easily determine the statistics data for the trace between bandmarkers (mean, standard deviation, and peak-to-peak). The following figure and table show the definitions for the statistics data elements.
Parameters Used for Calculating Statistics Data

|
Statistics data element |
Definition |
|
Average |
(n: number of points; xi: i measured value at the i-th measurement point) |
|
Standard deviation |
(n: number of points; xi: measured value at the i-th measurement point; mean: mean) |
|
Peak-to- |
Max - Min (Max: greatest measured value; Min: smallest measured value) |
Press Trace Next or Trace Max to activate the trace for which you want to obtain statistical data.
Press Marker Fctn > Analysis Range (X).
Press Marker Fctn > Analysis Range (Y)
Specify the range (X/Y-Axis) from which you want to obtain statistical data.
|
Analysis Range |
Description |
|
Full Range |
Statistical data are obtained from all traces. |
|
Bandmarker |
Statistical data are obtained from within bandmarker. |
To set up the bandmarker, refer to Setting Search Range (Bandmarkers).
Press Trace Next or Trace Max to activate the trace for which you want to obtain statistical data.
Press Marker Fctn.
Specify the range (X/Y-Axis) from which you want to obtain statistical data. For more information, refer to Specifying Range for Statistical Data.
Set the Analysis Type to Integral | Statistics | Linear Regression.
The values of Analysis type depend upon selected measurement. The values are different for different measurements.
Turning on the marker list displays statistics data in a list. To display the marker list, refer to Listing All Marker Values in All Displayed Traces.